> ## Documentation Index
> Fetch the complete documentation index at: https://docs.levelblue.com/llms.txt
> Use this file to discover all available pages before exploring further.
# Dashboard
The **Dashboard** page shows a summary of what goes on in the selected environment. It consists of four sections: **Health**, **Changes**, **Quick tasks**, and **To-do**.
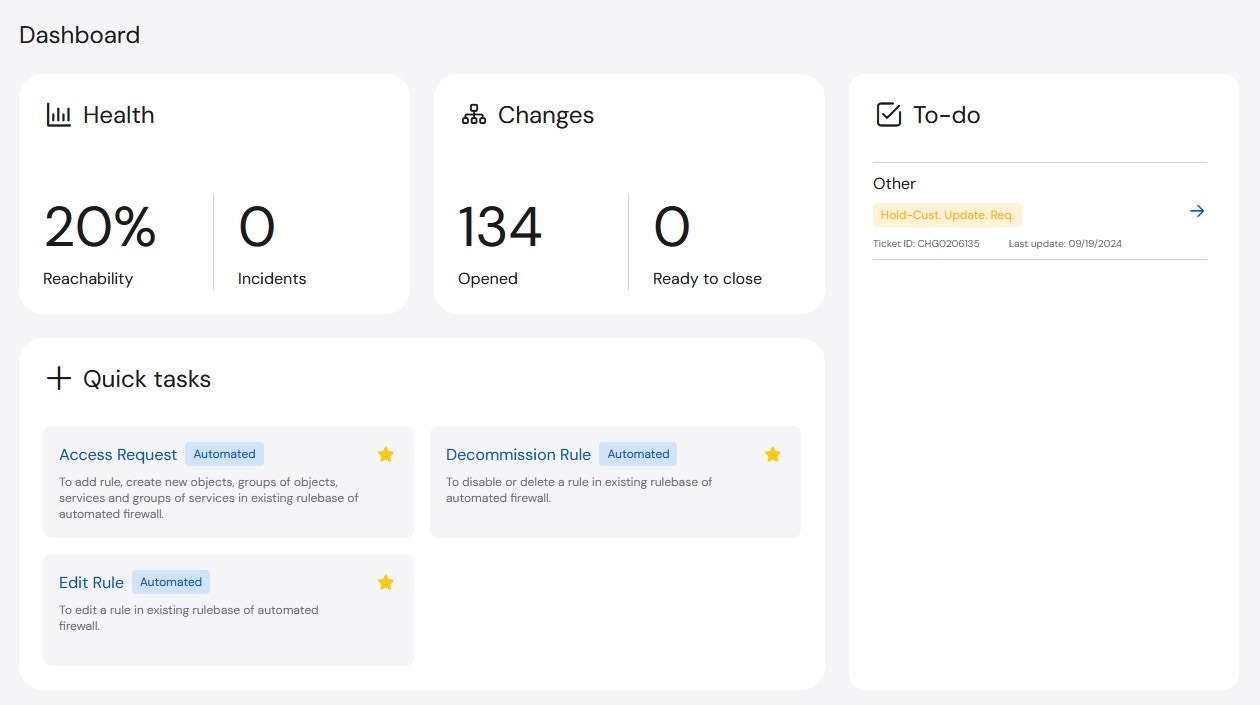 * **Health**: The Health widget provides information about the Reachability of all assets and the number of open Sev 1 and Sev 2 Incidents.
* **Reachability**: The Reachability widget measures how many assets are reachable and displays the value as a percentage of the whole. For example, if there are five devices and four are reachable, there is 80% Reachability.
* **Incidents**: The Incidents widget shows the number of open Sev1 and Sev2 Incidents.
* **Changes**: The Changes widget provides a summary for all **Open** and **Ready to Close** change tickets that are open across the company. Ready to Close changes are waiting for customer feedback in order to close.
* **To-Do**: The To-Do widget shows all outstanding Change tasks for the active user. Unlike the Changes widget, the items listed in the To-Do list are user specific, so it will only display outstanding items assigned to you (as the user who is currently logged in). You can click on the listed To-Do’s and will automatically be redirected to the open item.
* **Quick Tasks**: The Quick Tasks widget is on most pages of the platform and allows you to perform common tasks more easily. The tasks included in the Quick Tasks widget are **Automated Access Requests**, **Automated Decommission Rule**, and **Automated Edit Rule**.
If you select any of these tasks, you will be redirected to the page to complete the request.
* **Health**: The Health widget provides information about the Reachability of all assets and the number of open Sev 1 and Sev 2 Incidents.
* **Reachability**: The Reachability widget measures how many assets are reachable and displays the value as a percentage of the whole. For example, if there are five devices and four are reachable, there is 80% Reachability.
* **Incidents**: The Incidents widget shows the number of open Sev1 and Sev2 Incidents.
* **Changes**: The Changes widget provides a summary for all **Open** and **Ready to Close** change tickets that are open across the company. Ready to Close changes are waiting for customer feedback in order to close.
* **To-Do**: The To-Do widget shows all outstanding Change tasks for the active user. Unlike the Changes widget, the items listed in the To-Do list are user specific, so it will only display outstanding items assigned to you (as the user who is currently logged in). You can click on the listed To-Do’s and will automatically be redirected to the open item.
* **Quick Tasks**: The Quick Tasks widget is on most pages of the platform and allows you to perform common tasks more easily. The tasks included in the Quick Tasks widget are **Automated Access Requests**, **Automated Decommission Rule**, and **Automated Edit Rule**.
If you select any of these tasks, you will be redirected to the page to complete the request.