> ## Documentation Index
> Fetch the complete documentation index at: https://docs.levelblue.com/llms.txt
> Use this file to discover all available pages before exploring further.
# Complete the VMware Sensor Setup
After you initialize a new USM Anywhere Sensor, you must configure it in the Setup Wizard. As you complete the VMware Sensor configuration, USM Anywhere performs specific actions, like running an asset discovery scan and collecting logs.
## Accessing the Setup Wizard
The Setup Wizard is accessible under the following circumstances:
* After you first log in to the USM Anywhere web user interface (UI) and see the Welcome to USM Anywhere page, click **Get Started** to launch the Setup Wizard.
* If you have already registered one USM Anywhere Sensor but did not complete the setup before logging out, the USM Anywhere Sensor Configuration page launches automatically at your next login to remind you to finalize configuration of the sensor. From that page, you click **Configure** to launch the Setup Wizard and complete the sensor configuration.
* If you registered an additional USM Anywhere Sensor, but did not complete the setup, the Sensors page displays an error ( ) in the Configured column. See [Sensors Page Overview](../../user-guide/sensor-management/sensors-navigation) for more information.
Go to **Data Sources > Sensors**, and then click the sensor name to complete the sensor configuration. See [USM Anywhere Sensor Management](../../user-guide/sensor-management/sensor-management) for more information.
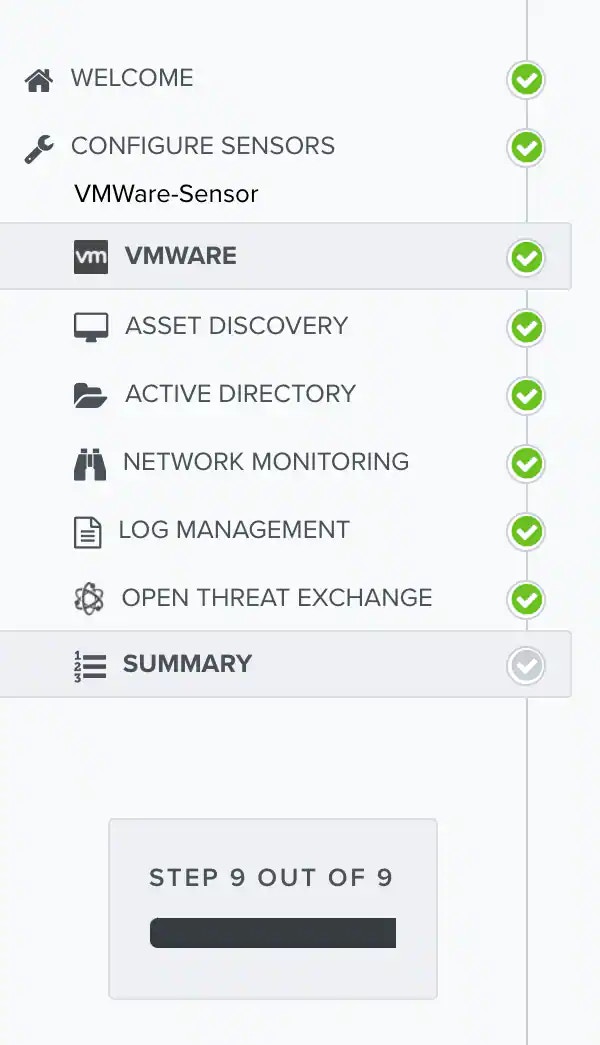
## Configuring the VMware Sensor in the Setup Wizard
The first time you log in from the Welcome to USM Anywhere web page, the Setup Wizard prompts you to complete the configuration of the first deployed sensor. Thereafter, you can use the Sensors page to configure an additional sensor or to change the configuration options for a deployed sensor. See [Sensors Page Overview](../../user-guide/sensor-management/sensors-navigation) for more information.
**Note:** You must have already configured your network interfaces for VMware. See [Set Up USM Anywhere on the VMware Virtual Machine](vmware-virtual-machine) for more information.
Within the Setup Wizard, complete the configuration on each page.
) in the Configured column. See [Sensors Page Overview](../../user-guide/sensor-management/sensors-navigation) for more information.
Go to **Data Sources > Sensors**, and then click the sensor name to complete the sensor configuration. See [USM Anywhere Sensor Management](../../user-guide/sensor-management/sensor-management) for more information.
## Configuring the VMware Sensor in the Setup Wizard
The first time you log in from the Welcome to USM Anywhere web page, the Setup Wizard prompts you to complete the configuration of the first deployed sensor. Thereafter, you can use the Sensors page to configure an additional sensor or to change the configuration options for a deployed sensor. See [Sensors Page Overview](../../user-guide/sensor-management/sensors-navigation) for more information.
**Note:** You must have already configured your network interfaces for VMware. See [Set Up USM Anywhere on the VMware Virtual Machine](vmware-virtual-machine) for more information.
Within the Setup Wizard, complete the configuration on each page.
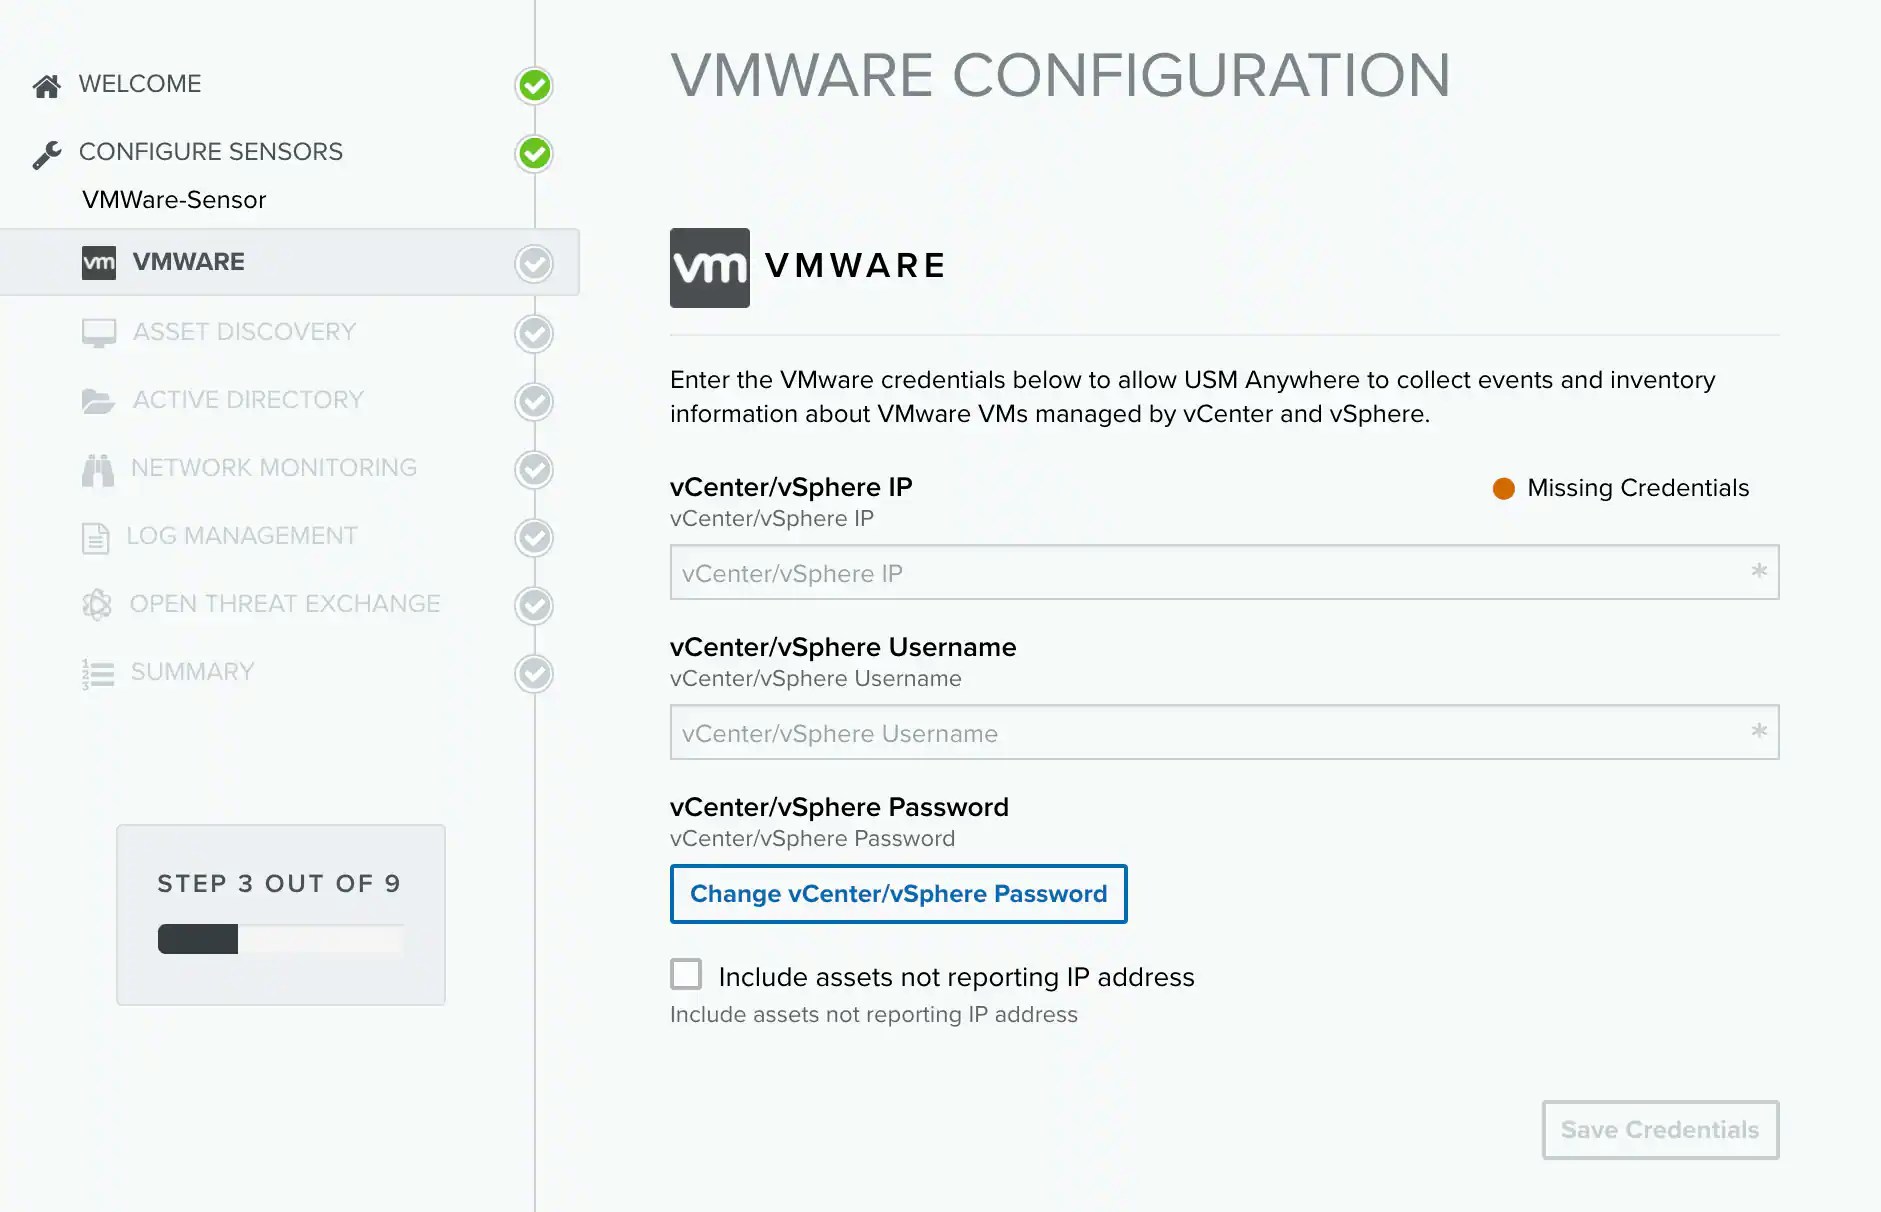
 The first page in the Setup Wizard for a VMware Sensor is VMware Configuration. The information that you provide on this page enables USM Anywhere to discover assets in your VMware environment and also collect events from that environment.
 **To complete the VMware configuration step**
1. Enter your VMware vCenter or VMware vSphere IP address and user credentials.
This should be a user account for the VMware environment with an assigned role that has permissions equivalent to the Read Only default role, which enables limited read access to the system without any other privileges.
2. (Optional) If you do not have VMware Tools installed on all virtual machines (VMs) in your vCenter or VMware vSphere environment but want the sensor to be able to discover them, select the **Include assets not reporting IP address** checkbox.
**Important:** VMware Tools identifies and associates all network assets reporting to the sensor, including the assets that don't report their IP addresses. However, if you have not used VMware Tools to map those assets on your network and you click the **Include assets not reporting IP address** checkbox during the configuration process, using asset discovery on the VMware Sensor can create duplicates of those unmapped assets that don't report their IP addresses because they were not uniquely identified and mapped previously by VMware Tools.
LevelBlue recommends that you install VMware Tools on all hosts in your vSphere or vCenter environment. This option is provided to handle situations where you are unable to do this.
**Note:** If you change this option while modifying the settings of a sensor that is already configured, you must provide the IP address and user credentials again.
3. Click **Save Credentials**.
4. Click **Next**.
The wizard opens the next page in the setup process, Asset Discovery.
When you move forward to Asset Discovery, a dialog box automatically opens and prompts you to allow asset scanning. USM Anywhere must discover your assets to enable security monitoring on them.
**To complete the asset discovery task**
1. Click **Yes** to start the automatic asset discovery.
**To complete the VMware configuration step**
1. Enter your VMware vCenter or VMware vSphere IP address and user credentials.
This should be a user account for the VMware environment with an assigned role that has permissions equivalent to the Read Only default role, which enables limited read access to the system without any other privileges.
2. (Optional) If you do not have VMware Tools installed on all virtual machines (VMs) in your vCenter or VMware vSphere environment but want the sensor to be able to discover them, select the **Include assets not reporting IP address** checkbox.
**Important:** VMware Tools identifies and associates all network assets reporting to the sensor, including the assets that don't report their IP addresses. However, if you have not used VMware Tools to map those assets on your network and you click the **Include assets not reporting IP address** checkbox during the configuration process, using asset discovery on the VMware Sensor can create duplicates of those unmapped assets that don't report their IP addresses because they were not uniquely identified and mapped previously by VMware Tools.
LevelBlue recommends that you install VMware Tools on all hosts in your vSphere or vCenter environment. This option is provided to handle situations where you are unable to do this.
**Note:** If you change this option while modifying the settings of a sensor that is already configured, you must provide the IP address and user credentials again.
3. Click **Save Credentials**.
4. Click **Next**.
The wizard opens the next page in the setup process, Asset Discovery.
When you move forward to Asset Discovery, a dialog box automatically opens and prompts you to allow asset scanning. USM Anywhere must discover your assets to enable security monitoring on them.
**To complete the asset discovery task**
1. Click **Yes** to start the automatic asset discovery.
 Or if you prefer to add the assets manually or scan another network, click No and skip to the next step.
During the automated scan, the Scan Networks status bar opens and displays the number of assets detected in your network range.
Or if you prefer to add the assets manually or scan another network, click No and skip to the next step.
During the automated scan, the Scan Networks status bar opens and displays the number of assets detected in your network range.
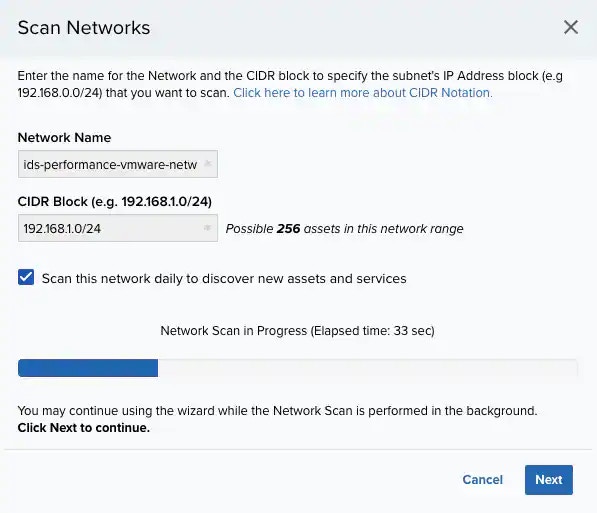 When the scan stops, you have these options:
* Click **Scan Another** to scan a different set of assets
* Click **Next** to continue with asset discovery setup options
When the initial asset scan dialog box closes, the Asset Discovery page displays status information for an ongoing scan or any discovered assets for completed scans.
When the scan stops, you have these options:
* Click **Scan Another** to scan a different set of assets
* Click **Next** to continue with asset discovery setup options
When the initial asset scan dialog box closes, the Asset Discovery page displays status information for an ongoing scan or any discovered assets for completed scans.
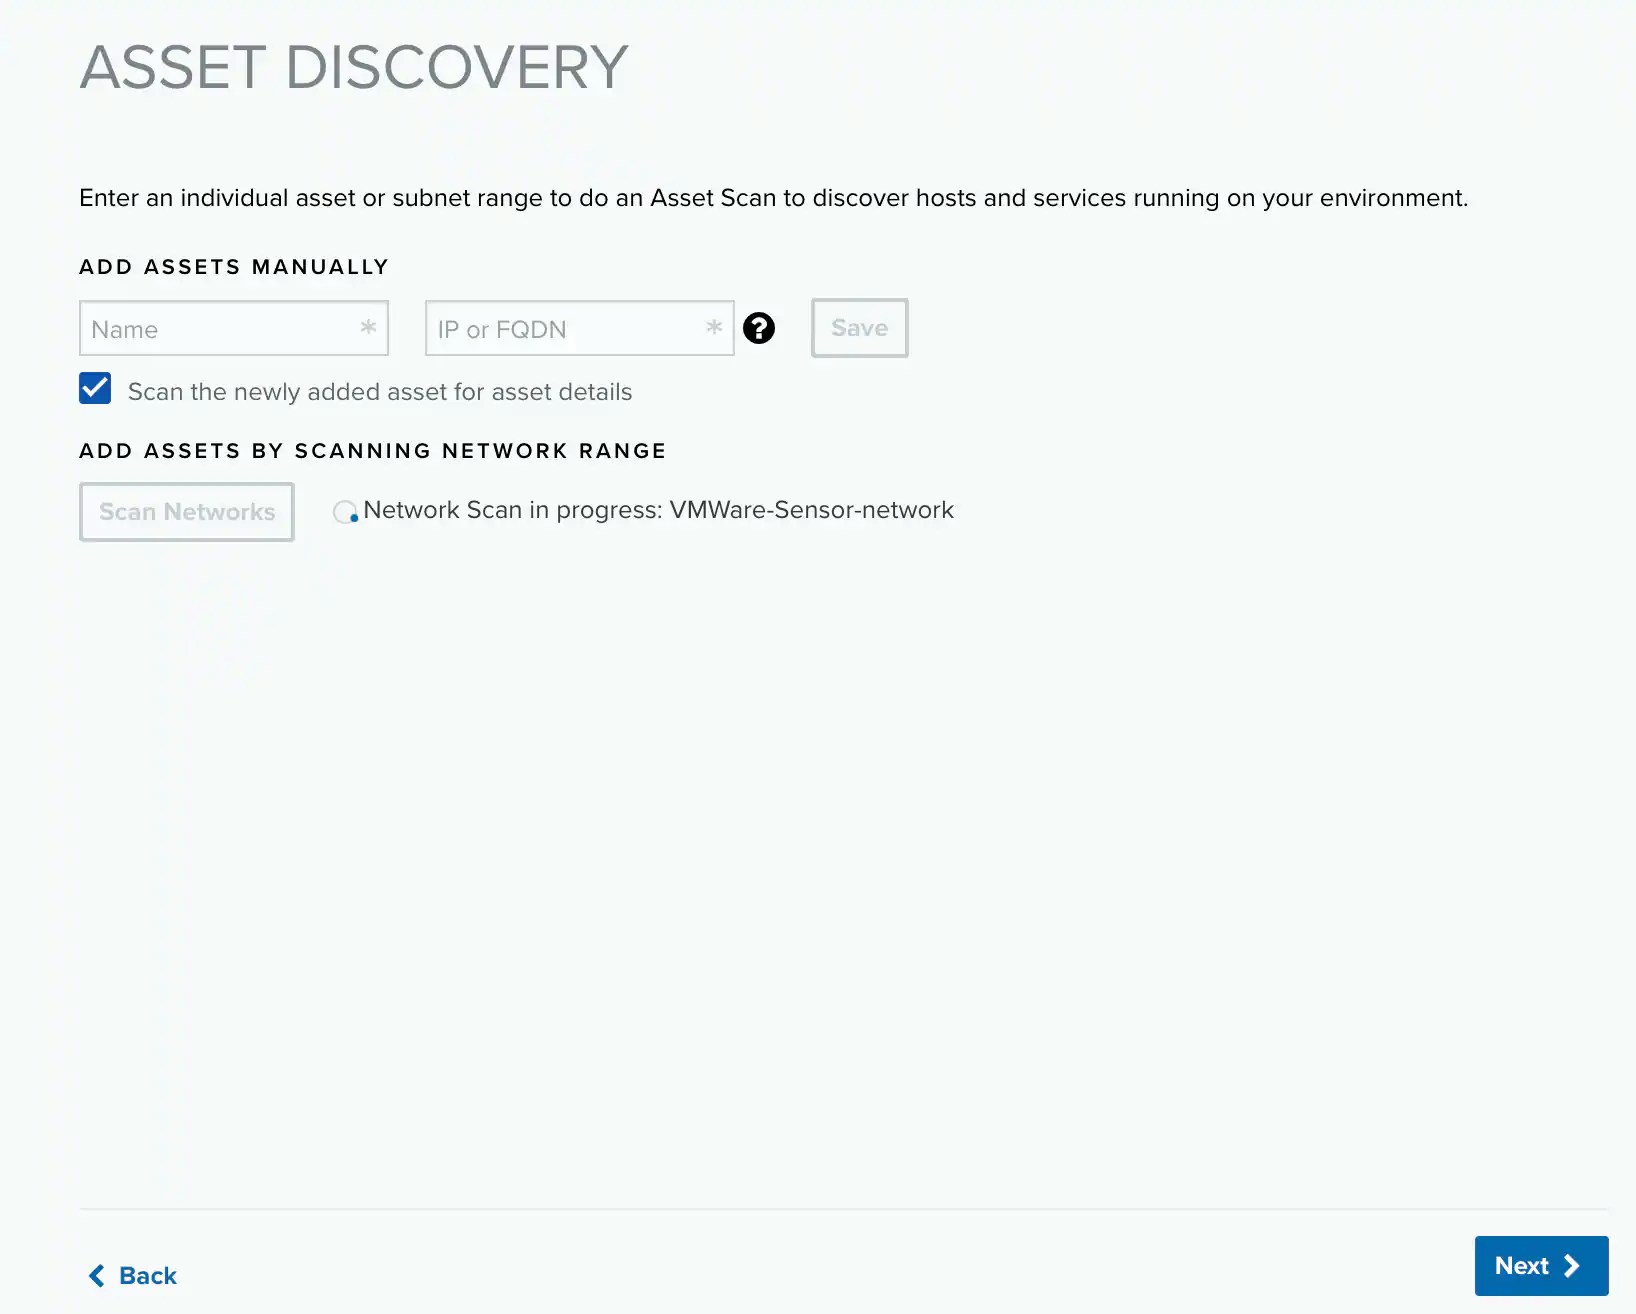 2. (Optional) **Add assets manually**
Enter the name and IP address or fully qualified domain name (FQDN) to specify an asset for discovery. The scan option is selected by default. Click Save to add the asset.
You can repeat this for each individual asset you want to add.
3. (Optional) **Add assets by scanning network range**
Click **Scan Networks** to scan a network range that you specify. This runs asset discovery to scan hosts and services running on the specified network range.
4. When all the needed assets are discovered, click **Next** at the bottom of the page.
The wizard opens the next page in the setup process, Active Directory.
The optional Active Directory (AD) setup page configures USM Anywhere to collect information from your AD account. To monitor Microsoft Windows systems effectively, USM Anywhere needs access to the AD server to collect inventory information.
**Note:** This configuration is only for one AD server. If you want to scan different AD servers, you must create an AD scan job for each of them. See [Scheduling Active Directory Scans from the Job Scheduler Page](../data-source/asset-scan-active-directory) for more information.
LevelBlue recommends that you create a dedicated AD account with membership in the Domain Admins group to be used by USM Anywhere to log in to the Windows systems. You also need to activate Microsoft Windows Remote Management (WinRM) in the domain controller and in all the hosts that you want to scan. You can do this by using a group policy for all the systems in your AD.
**Important:** Before this feature is fully functional, you must configure access to the USM Anywhere Sensor on the AD server. See [Granting Access to Active Directory for USM Anywhere](../setup/granting-access-to-ad-from-usma) for more information.
**To complete the AD access configuration**
1. Provide the AD credentials for USM Anywhere:
* **Active Directory IP Address**: Enter the IP address for the AD server.
* **Username**: Enter your username as admin of the account.
* **Password**: Enter your admin's password.
* **Domain**: Enter the domain for the AD instance.
2. (Optional) **Add assets manually**
Enter the name and IP address or fully qualified domain name (FQDN) to specify an asset for discovery. The scan option is selected by default. Click Save to add the asset.
You can repeat this for each individual asset you want to add.
3. (Optional) **Add assets by scanning network range**
Click **Scan Networks** to scan a network range that you specify. This runs asset discovery to scan hosts and services running on the specified network range.
4. When all the needed assets are discovered, click **Next** at the bottom of the page.
The wizard opens the next page in the setup process, Active Directory.
The optional Active Directory (AD) setup page configures USM Anywhere to collect information from your AD account. To monitor Microsoft Windows systems effectively, USM Anywhere needs access to the AD server to collect inventory information.
**Note:** This configuration is only for one AD server. If you want to scan different AD servers, you must create an AD scan job for each of them. See [Scheduling Active Directory Scans from the Job Scheduler Page](../data-source/asset-scan-active-directory) for more information.
LevelBlue recommends that you create a dedicated AD account with membership in the Domain Admins group to be used by USM Anywhere to log in to the Windows systems. You also need to activate Microsoft Windows Remote Management (WinRM) in the domain controller and in all the hosts that you want to scan. You can do this by using a group policy for all the systems in your AD.
**Important:** Before this feature is fully functional, you must configure access to the USM Anywhere Sensor on the AD server. See [Granting Access to Active Directory for USM Anywhere](../setup/granting-access-to-ad-from-usma) for more information.
**To complete the AD access configuration**
1. Provide the AD credentials for USM Anywhere:
* **Active Directory IP Address**: Enter the IP address for the AD server.
* **Username**: Enter your username as admin of the account.
* **Password**: Enter your admin's password.
* **Domain**: Enter the domain for the AD instance.
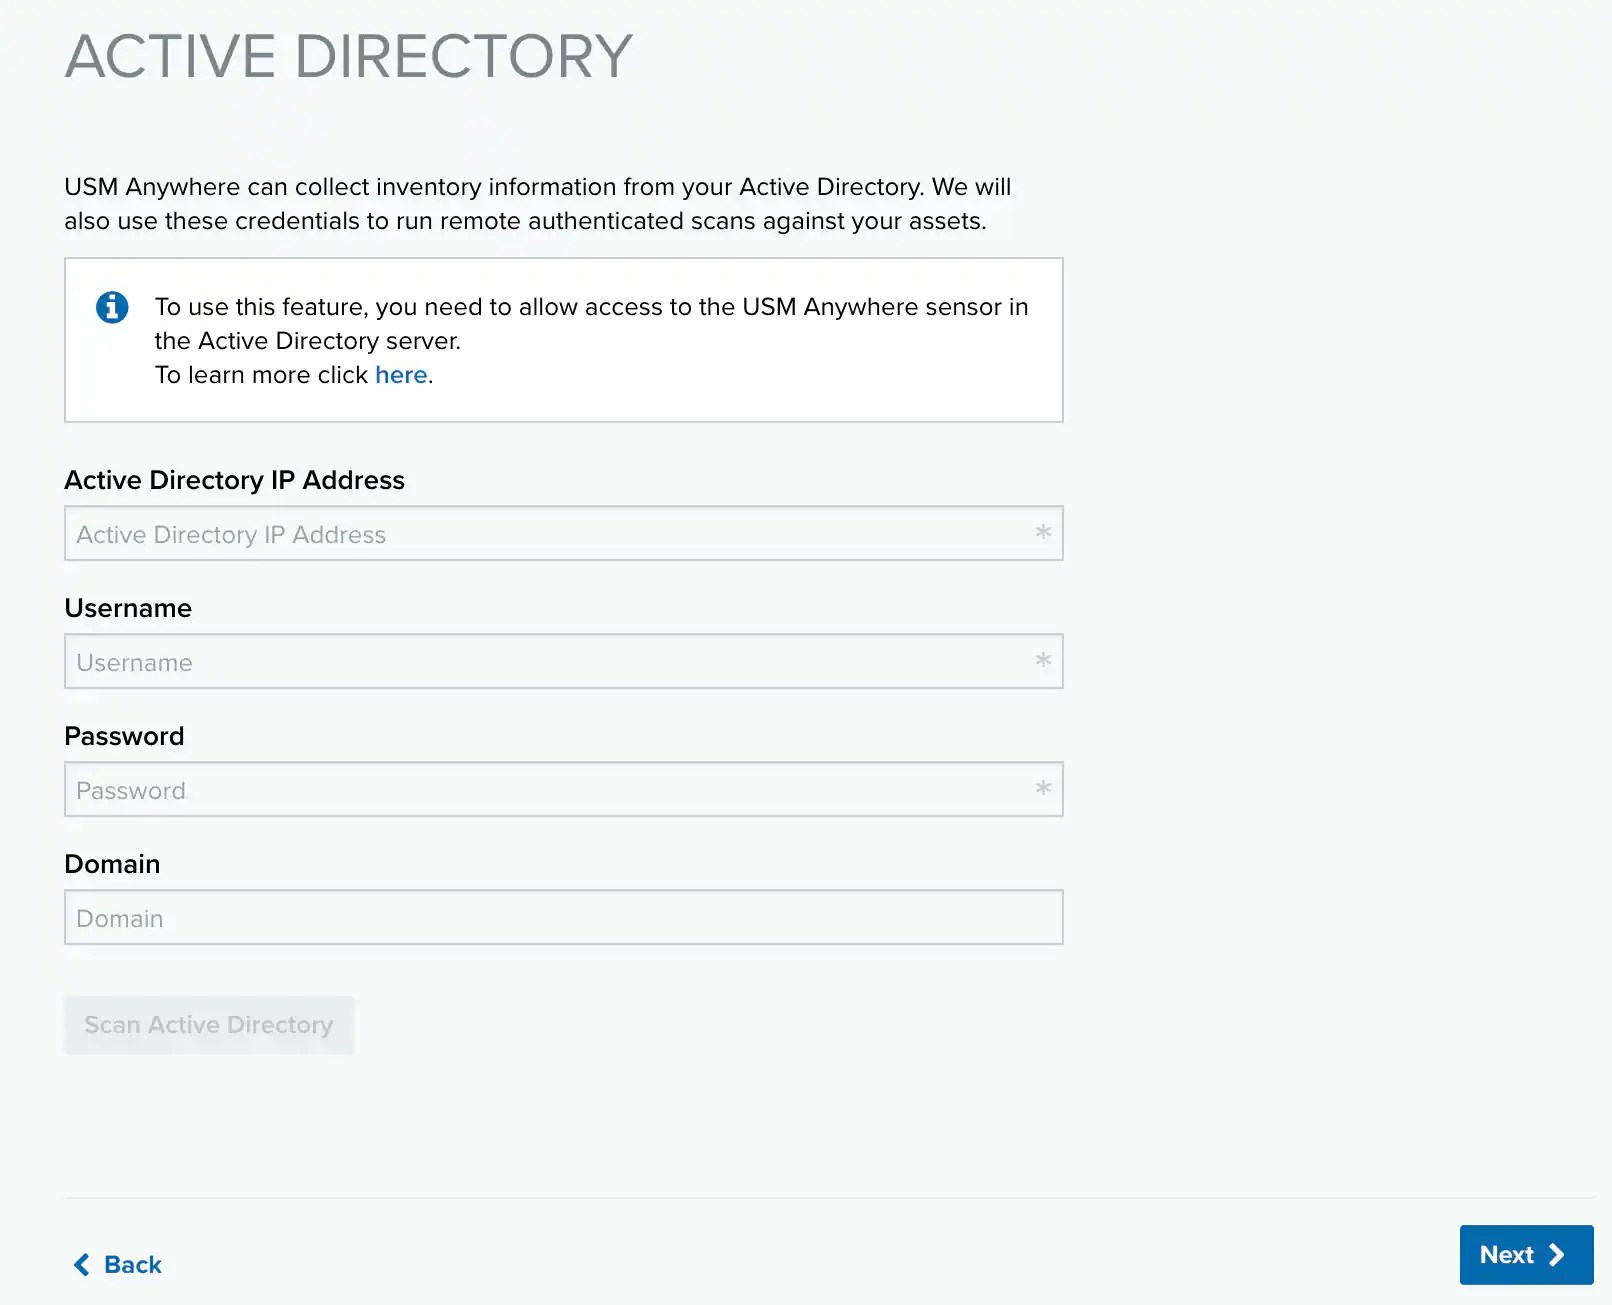 2. Click **Scan Active Directory**.
After a successful launch of the scan, a confirmation dialog box opens.
2. Click **Scan Active Directory**.
After a successful launch of the scan, a confirmation dialog box opens.
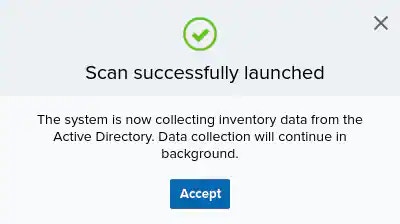 3. Click **Accept**.
The scan continues in the background.
Upon completion, another dialog box opens and provides information about the number of assets USM Anywhere discovered. It also prompts you to decide if you want to scan for hosts and services running in your environment.
3. Click **Accept**.
The scan continues in the background.
Upon completion, another dialog box opens and provides information about the number of assets USM Anywhere discovered. It also prompts you to decide if you want to scan for hosts and services running in your environment.
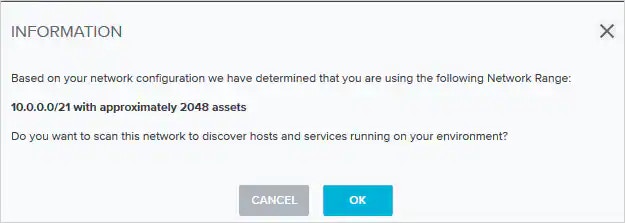 Click **Cancel** to opt out of this scan.
4. (Optional) If you want to scan for other hosts and services, click **OK**.
5. Click **Next** after the scan ends.
The wizard opens the next page in the setup process, Network Security Monitoring.
The Network Security Monitoring page shows the status of the network interfaces monitored by the sensor (it could take a few moments to load the interfaces). All network adapters are configured for network monitoring by default.
You must manually enable port mirroring or port spanning, promiscuous mode, or both in a virtual switch to send a copy of the network traffic you want to analyze to these interfaces. This page provides links to documentation about how to configure your networking to allow for the interfaces to see the network traffic and perform network intrusion detection.
**Note:** You must have already configured your network interfaces for VMware. See [Set Up USM Anywhere on the VMware Virtual Machine](vmware-virtual-machine) for more information.
USM Anywhere connectivity and communications are handled by the first network interface connection on the Network Security Monitoring page. This is the primary network that provides asset scanning and log collection for the particular network.
You can connect additional interfaces to other networks for monitoring, or connect them to individual vSwitch port groups for virtual networks. Each interface should be connected to a vSwitch that mirrors a different subnet within your network.
Click **Cancel** to opt out of this scan.
4. (Optional) If you want to scan for other hosts and services, click **OK**.
5. Click **Next** after the scan ends.
The wizard opens the next page in the setup process, Network Security Monitoring.
The Network Security Monitoring page shows the status of the network interfaces monitored by the sensor (it could take a few moments to load the interfaces). All network adapters are configured for network monitoring by default.
You must manually enable port mirroring or port spanning, promiscuous mode, or both in a virtual switch to send a copy of the network traffic you want to analyze to these interfaces. This page provides links to documentation about how to configure your networking to allow for the interfaces to see the network traffic and perform network intrusion detection.
**Note:** You must have already configured your network interfaces for VMware. See [Set Up USM Anywhere on the VMware Virtual Machine](vmware-virtual-machine) for more information.
USM Anywhere connectivity and communications are handled by the first network interface connection on the Network Security Monitoring page. This is the primary network that provides asset scanning and log collection for the particular network.
You can connect additional interfaces to other networks for monitoring, or connect them to individual vSwitch port groups for virtual networks. Each interface should be connected to a vSwitch that mirrors a different subnet within your network.
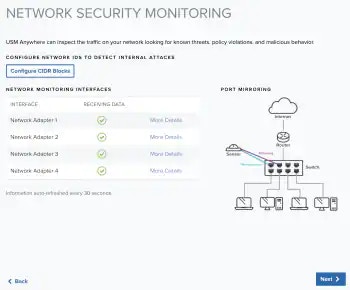 Use this page to verify that USM Anywhere can monitor your network traffic for security events.
**Note:** You can see red X icons next to the interfaces if the port mirroring or promiscuous mode is not configured. You might also see these icons if the network interfaces have not seen any traffic in the past 30 seconds.
On the Log Management page are syslog port numbers. (These ports are the same for all USM Anywhere Sensors.)
USM Anywhere collects third-party device, system, and application data through syslog over UDP on port 514 and over TCP on ports 601 or 602 by default. It collects Transport Layer Security (TLS)-encrypted data through TCP on ports 6514 or 6515 by default. These ports support the RFC 3164 and RFC 5424 formats. To configure any third-party devices to send data to USM Anywhere, you must provide the IP address and the port number of your USM Anywhere Sensor.
Use this page to verify that USM Anywhere can monitor your network traffic for security events.
**Note:** You can see red X icons next to the interfaces if the port mirroring or promiscuous mode is not configured. You might also see these icons if the network interfaces have not seen any traffic in the past 30 seconds.
On the Log Management page are syslog port numbers. (These ports are the same for all USM Anywhere Sensors.)
USM Anywhere collects third-party device, system, and application data through syslog over UDP on port 514 and over TCP on ports 601 or 602 by default. It collects Transport Layer Security (TLS)-encrypted data through TCP on ports 6514 or 6515 by default. These ports support the RFC 3164 and RFC 5424 formats. To configure any third-party devices to send data to USM Anywhere, you must provide the IP address and the port number of your USM Anywhere Sensor.
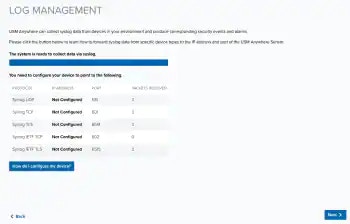 **To enable log collection and configure your log management**
1. Make sure that you have granted the necessary permissions for your OS to allow USM Anywhere to access its logs. You can also integrate a wide variety of data sources to send log data over syslog to the USM Anywhere Sensor.
To learn how to configure your operating systems and supported third-party devices to forward syslog log data, see the following related topics:
* [The Syslog Server Sensor App](../data-source/app-sensor-syslog): Log collection (UDP, TCP, and TLS-encrypted TCP) from rsyslog
* [Collecting Linux System Logs](../setup/collecting-logs-linux): Log collection from a Linux system
* [Collecting Windows System Logs](../setup/collecting-logs-windows): Log collection from a Windows system
* Go to the specific BlueApp in USM Anywhere for instructions about syslog forwarding
**Note:** Because the log scan can take some time, you might not see all of the automatically discovered log sources immediately after deploying the first USM Anywhere Sensor.
2. When you have finished the log collection setup and integrated any needed plugins, verify that the data transfer is occurring.
3. Click **Next** when this step is complete.
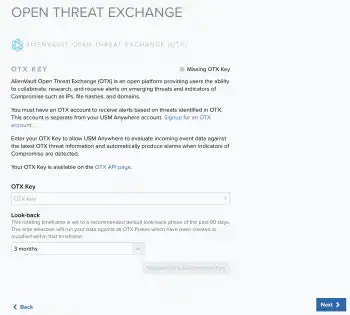
LevelBlue Labs™ Open Threat Exchange® (OTX™) is an open information-sharing and analysis network providing users with the ability to collaborate, research, and receive alerts on emerging threats and indicators of compromise (IoCs) such as IP addresses, file hashes, and domains.
You must have an OTX account to receive alerts based on threats identified in OTX. This account is separate from your USM Anywhere account. Go to [The World’s First Truly Open Threat Intelligence Community](https://otx.alienvault.com/) to create an OTX account.
**To enable log collection and configure your log management**
1. Make sure that you have granted the necessary permissions for your OS to allow USM Anywhere to access its logs. You can also integrate a wide variety of data sources to send log data over syslog to the USM Anywhere Sensor.
To learn how to configure your operating systems and supported third-party devices to forward syslog log data, see the following related topics:
* [The Syslog Server Sensor App](../data-source/app-sensor-syslog): Log collection (UDP, TCP, and TLS-encrypted TCP) from rsyslog
* [Collecting Linux System Logs](../setup/collecting-logs-linux): Log collection from a Linux system
* [Collecting Windows System Logs](../setup/collecting-logs-windows): Log collection from a Windows system
* Go to the specific BlueApp in USM Anywhere for instructions about syslog forwarding
**Note:** Because the log scan can take some time, you might not see all of the automatically discovered log sources immediately after deploying the first USM Anywhere Sensor.
2. When you have finished the log collection setup and integrated any needed plugins, verify that the data transfer is occurring.
3. Click **Next** when this step is complete.
LevelBlue Labs™ Open Threat Exchange® (OTX™) is an open information-sharing and analysis network providing users with the ability to collaborate, research, and receive alerts on emerging threats and indicators of compromise (IoCs) such as IP addresses, file hashes, and domains.
You must have an OTX account to receive alerts based on threats identified in OTX. This account is separate from your USM Anywhere account. Go to [The World’s First Truly Open Threat Intelligence Community](https://otx.alienvault.com/) to create an OTX account.
 **Note:** If you do not already have an OTX account, click the **Sign up** link. This opens another browser tab or window that displays the OTX signup page. After you confirm your email address, you can log in to OTX and retrieve the unique API key for your account.
See Open Threat Exchange® and USM Anywhere for more information about OTX integration in USM Anywhere.
**To enable USM Anywhere to evaluate event data against the latest OTX intelligence**
1. Log in to OTX and open the API page ([https://otx.alienvault.com/api](https://otx.alienvault.com/api)).
2. In the DirectConnect API Usage pane, click the
**Note:** If you do not already have an OTX account, click the **Sign up** link. This opens another browser tab or window that displays the OTX signup page. After you confirm your email address, you can log in to OTX and retrieve the unique API key for your account.
See Open Threat Exchange® and USM Anywhere for more information about OTX integration in USM Anywhere.
**To enable USM Anywhere to evaluate event data against the latest OTX intelligence**
1. Log in to OTX and open the API page ([https://otx.alienvault.com/api](https://otx.alienvault.com/api)).
2. In the DirectConnect API Usage pane, click the  icon to copy your unique OTX connection key.
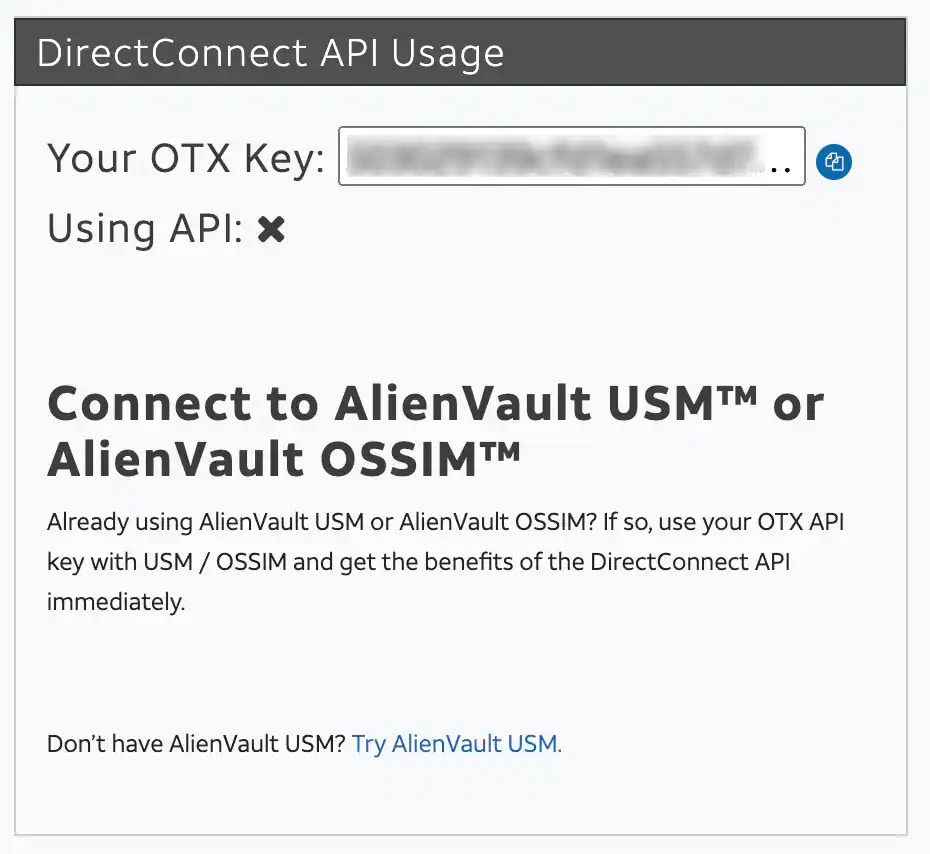 3. Return to the Open Threat Exchange (OTX) page of the USM Anywhere Sensor Setup Wizard and paste the value in the OTX Key text box.
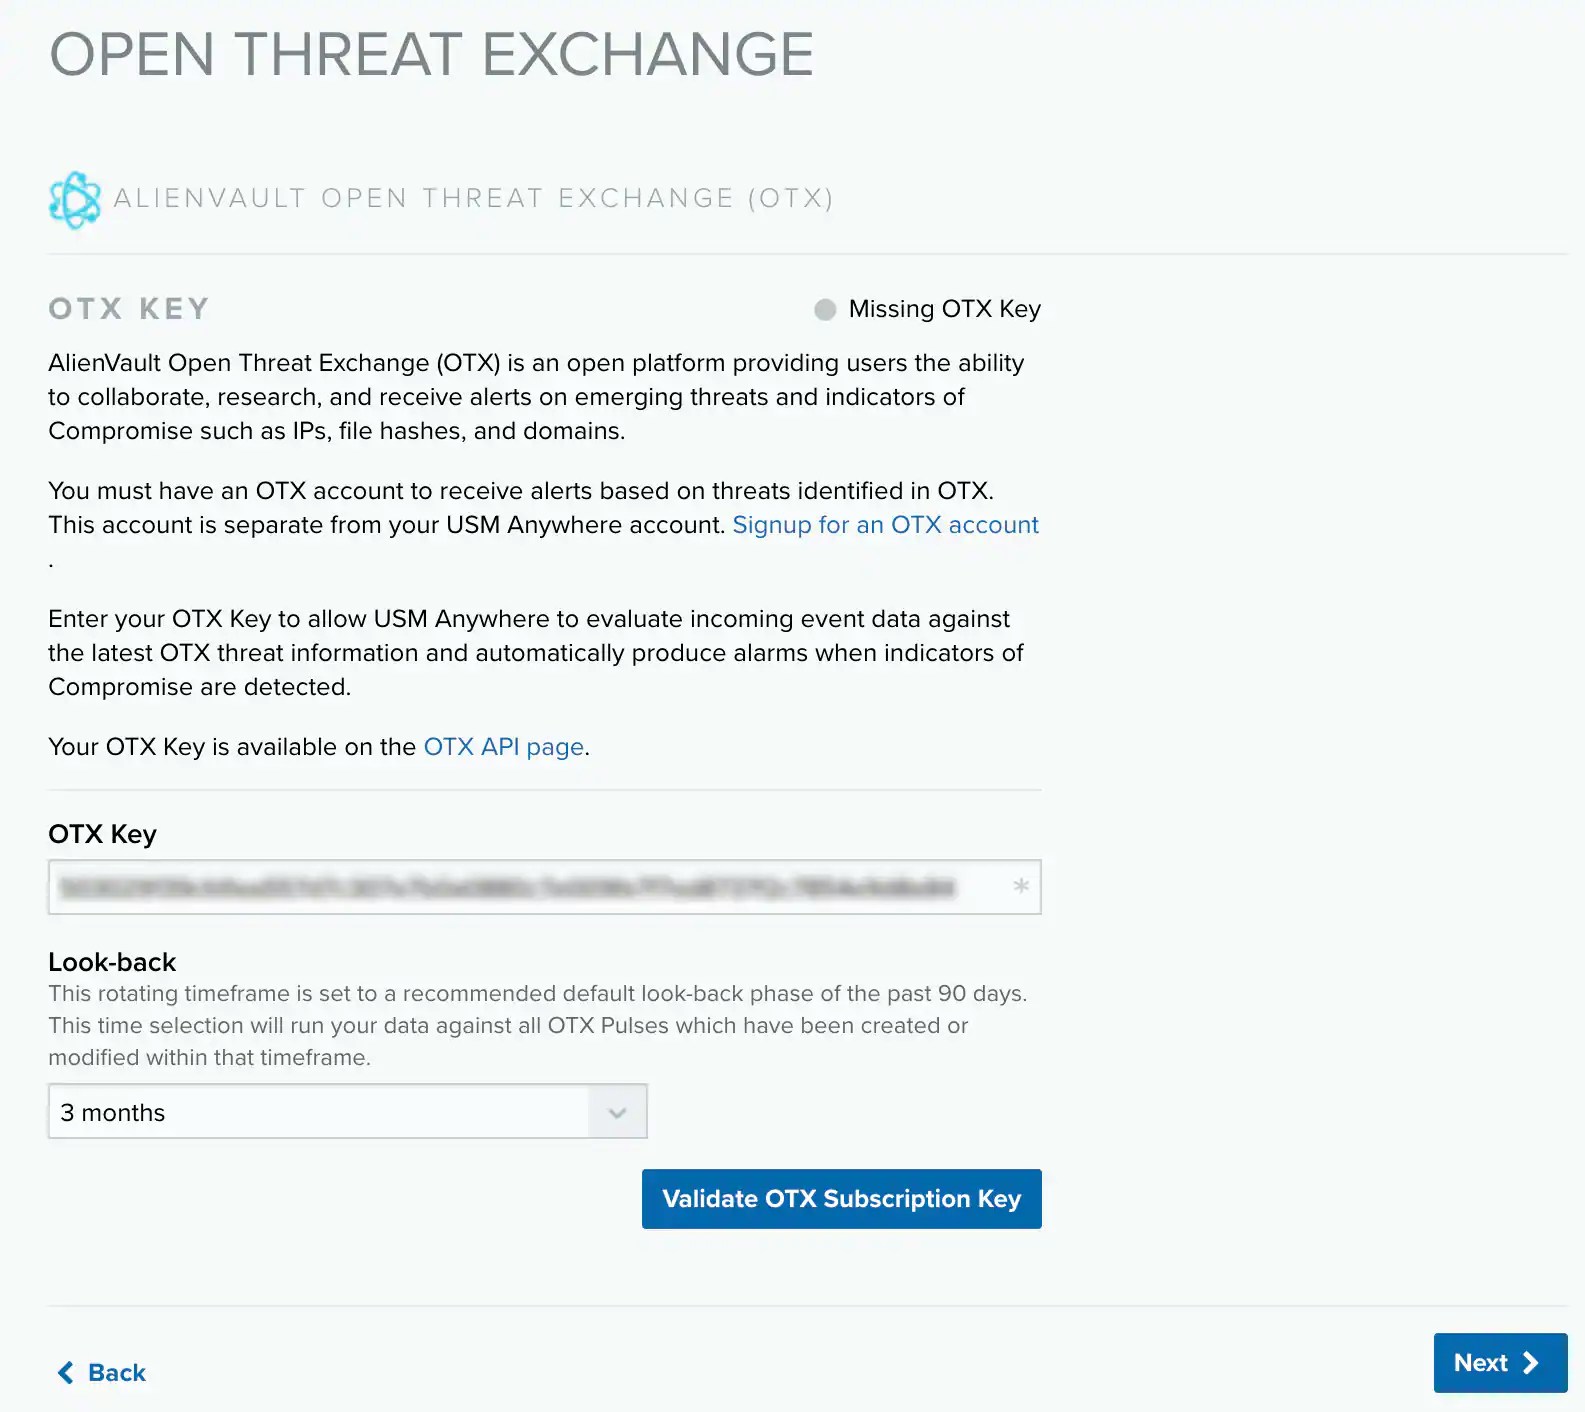 4. Click **Validate OTX Subscription Key**.
With a successful validation of the key, the status at the top of the page changes to "Valid OTX key".
5. Click **Next** when this task is complete.
Now is a great time to run a vulnerability scan. See [Vulnerability Assessment](../../user-guide/vulnerability-assessment/vulnerability-assessment) for detailed information about running a vulnerability scan.
4. Click **Validate OTX Subscription Key**.
With a successful validation of the key, the status at the top of the page changes to "Valid OTX key".
5. Click **Next** when this task is complete.
Now is a great time to run a vulnerability scan. See [Vulnerability Assessment](../../user-guide/vulnerability-assessment/vulnerability-assessment) for detailed information about running a vulnerability scan.