> ## Documentation Index
> Fetch the complete documentation index at: https://docs.levelblue.com/llms.txt
> Use this file to discover all available pages before exploring further.
# Alarms List View
Role Availability | ✔️ Read-Only ✔️ Investigator ✔️ Analyst ✔️ Manager
USM Anywhere provides a centralized view of your alarma. Go to **Activity > Alarms** to see this centralized view.
You can watch the [Conducting Security Analysis with LevelBlue USM Anywhere](https://cybersecurity.att.com/customer-webcasts/conducting-security-analysis-with-alienvault-usm-anywhere) customer training webcast on-demand to learn how to leverage USM Anywhere to perform security analyst duties.
The Alarms page displays information on alarms. These are the different parts of the Alarms page:
* On the left side of the page are the search and filters options. Use filters to delimit your search.
* At the top of the page, you can see any filters you have applied, and you have the option to create and select different views of the alarms.
* The main part of the page is the list of alarms, where each row describes an individual alarm. Click an alarm to open a summary view. See [Viewing Alarm Details](documentation/usm-anywhere/user-guide/alarms/viewing-alarms-details) for more information. Each alarm includes a checkbox that you can use to select it. You can select all alarms in the same page by clicking the checkbox in the first column of the header row. You can also select all the alarms in the system. See [Selecting Alarms in Alarm List View](documentation/usm-anywhere/user-guide/alarms/selecting-alarms) for more information.
An alarm is created when USM Anywhere receives the event, which may appear later than the time when the event was created. You can verify by comparing the Time Created and Time Received field of an event.
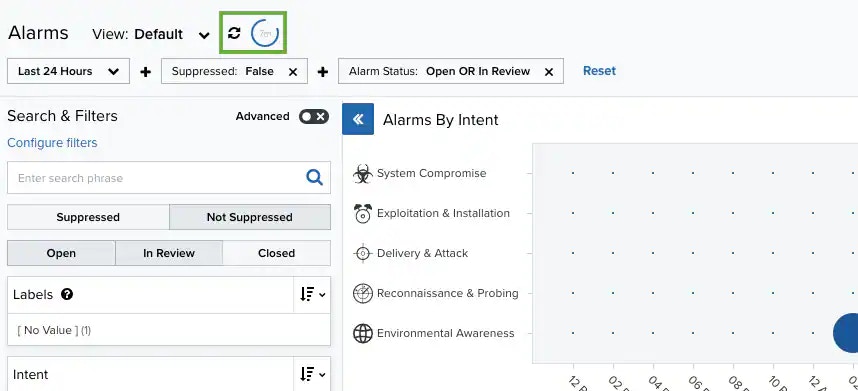
## Refreshing the Page
USM Anywhere gives you the option of refreshing the page automatically in a period of time that you can configure. There is an auto-refresh countdown that refreshes the page at a regular interval. The number inside the blue circle indicates the remaining time until the next refresh. See [Select the Time for Auto-Refreshing the Alarms and Dashboard Pages](/documentation/usm-anywhere/user-guide/user-management/profile-settings#autorefresh) to configure this interval. You can click the  icon to stop the auto-refresh countdown and refresh the page manually.
 ## Alarm Summary Graph
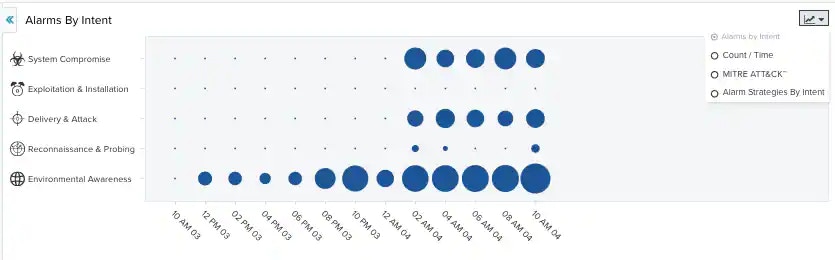
The graph at the top of the Alarms page provides a graphical representation of alarms by intent. The blue circles indicate the number of times that an alarm in an intent occurred. A bigger circle indicates a higher number of alarms. You can hover over each of the circles to get the actual number of alarms per intent. In addition, clicking a blue circle displays a list of only the alarms corresponding to that circle. You can change the displayed period of time by clicking the **Last 24 Hours** filter.
Alarms graphed by intent are sorted into five different categories, which are represented by the graphic icons in the display:
* Delivery & Attack (
## Alarm Summary Graph
The graph at the top of the Alarms page provides a graphical representation of alarms by intent. The blue circles indicate the number of times that an alarm in an intent occurred. A bigger circle indicates a higher number of alarms. You can hover over each of the circles to get the actual number of alarms per intent. In addition, clicking a blue circle displays a list of only the alarms corresponding to that circle. You can change the displayed period of time by clicking the **Last 24 Hours** filter.
Alarms graphed by intent are sorted into five different categories, which are represented by the graphic icons in the display:
* Delivery & Attack ( )
* Environmental Awareness (
)
* Environmental Awareness ( )
* Exploitation & Installation (
)
* Exploitation & Installation ( )
* Reconnaissance & Probing (
)
* Reconnaissance & Probing ( )
* System Compromise (
)
* System Compromise ( )
If you want to analyze the data and see the additional columns without having to scroll left and right, you can maximize the screen and hide the filter pane. Click the
)
If you want to analyze the data and see the additional columns without having to scroll left and right, you can maximize the screen and hide the filter pane. Click the  icon to hide the filter pane. Click the
  icon to expand the filter pane.
 Use the
  icon to change the alarms view.
 The icon accesses these options:
* Alarms by Intent: This view is a bubble graph that provides a graphical representation of alarms by intent.
* Count/Time: This view provides a graphical representation of the number of alarms in a period of time.
The period of time is mapped with the `timestamp_received` field. This field can be overwritten by the current sensor UTC timestamp if, when processing events, a delay is detected up to 15 minutes or the `timestamp_received` field is not provided.
* **MITRE ATT\&CK**: The MITRE ATT\&CK (Adversarial Tactics, Techniques, and Common Knowledge) is a framework for understanding attackers' behaviors and actions.
* **Alarm Strategies by Intent**: This view is a table that provides a representation of alarms strategies by intent.
## The MITRE ATT\&CK View
USM Anywhere and LevelBlue Labs™ Open Threat Exchange® (OTX™) include MITRE ATT\&CK information. The alarms view incorporates a table with tactics and techniques to describe adversarial actions and behaviors. Techniques are specific actions an attacker might take and tactics are phases of attacker behavior. This view includes the alarms mapping to their corresponding ATT\&CK techniques and helps you to understand the context and the scope of an attack. See [MITRE ATT\&CK](https://attack.mitre.org/) for more information.
The icon accesses these options:
* Alarms by Intent: This view is a bubble graph that provides a graphical representation of alarms by intent.
* Count/Time: This view provides a graphical representation of the number of alarms in a period of time.
The period of time is mapped with the `timestamp_received` field. This field can be overwritten by the current sensor UTC timestamp if, when processing events, a delay is detected up to 15 minutes or the `timestamp_received` field is not provided.
* **MITRE ATT\&CK**: The MITRE ATT\&CK (Adversarial Tactics, Techniques, and Common Knowledge) is a framework for understanding attackers' behaviors and actions.
* **Alarm Strategies by Intent**: This view is a table that provides a representation of alarms strategies by intent.
## The MITRE ATT\&CK View
USM Anywhere and LevelBlue Labs™ Open Threat Exchange® (OTX™) include MITRE ATT\&CK information. The alarms view incorporates a table with tactics and techniques to describe adversarial actions and behaviors. Techniques are specific actions an attacker might take and tactics are phases of attacker behavior. This view includes the alarms mapping to their corresponding ATT\&CK techniques and helps you to understand the context and the scope of an attack. See [MITRE ATT\&CK](https://attack.mitre.org/) for more information.
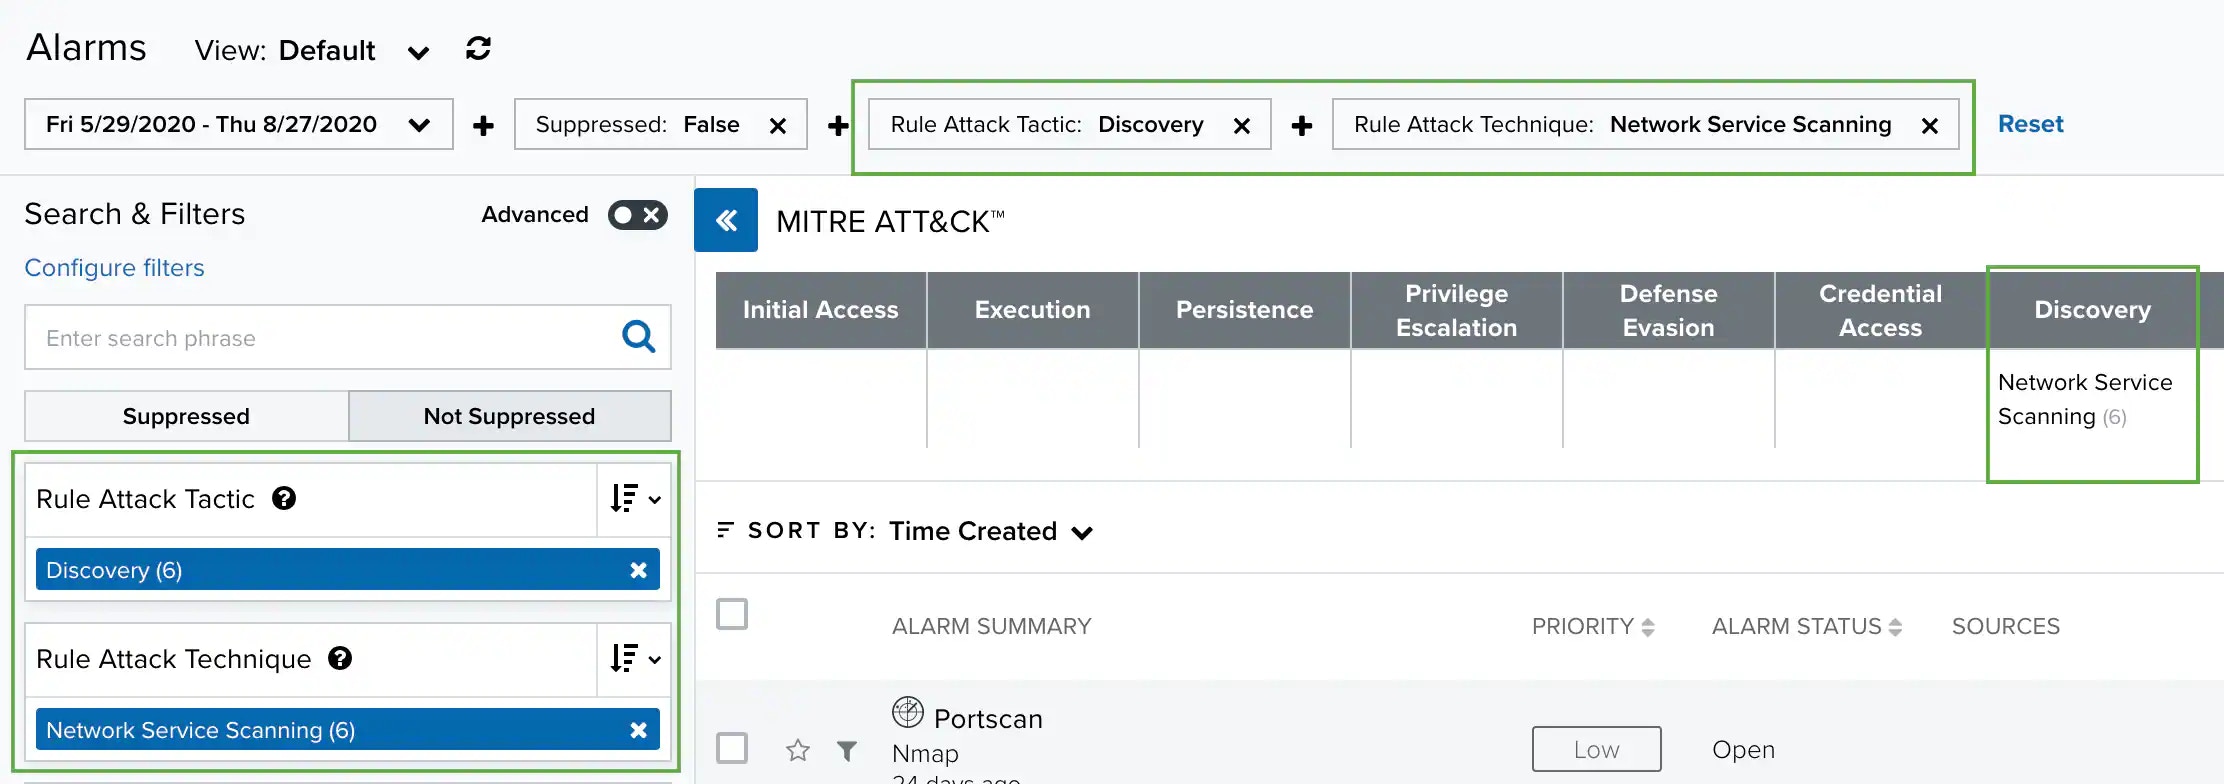
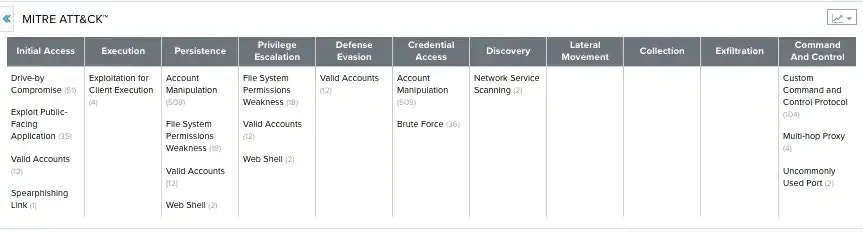 The headers of the table are the 11 ATT\&CK tactics, and each tactic has numerous techniques, which are the rows. The tooltips match the identification (ID) technique provided by MITRE ATT\&CK. Some techniques display in several tactics. If you click on one of the techniques, the specific filters are added and the list shows the result.
 USM Anywhere includes the [MITRE ATT\&CK Dashboard](https://cybersecurity.att.com/documentation/usm-anywhere/user-guide/dashboards/mitre-att-ck.htm) to display MITRE ATT\&CK information.
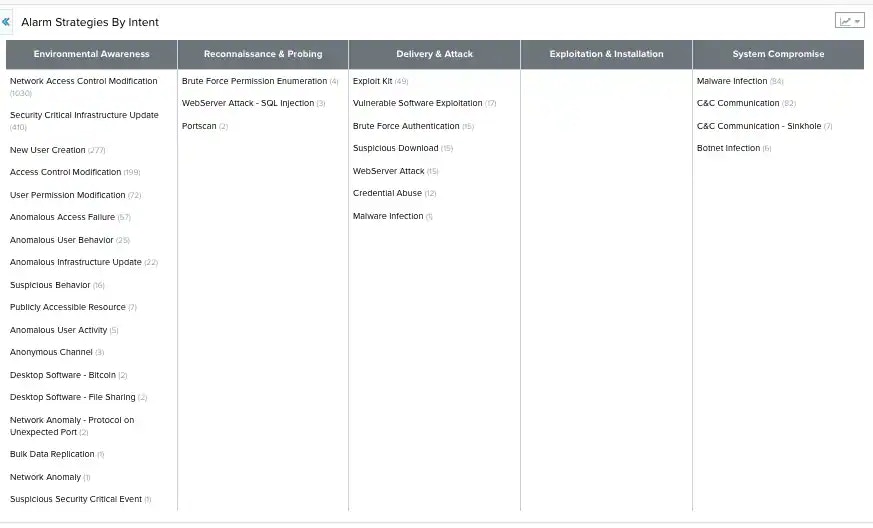
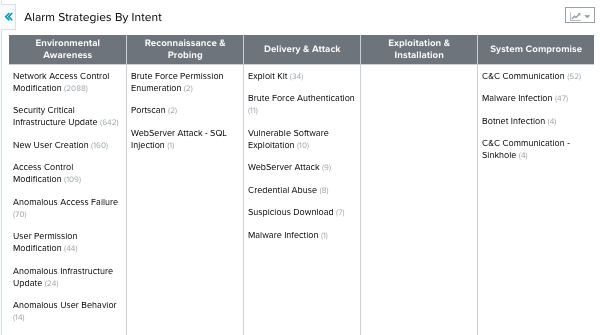
## The Alarm Strategies by Intent View
The Alarm Strategies by Intent view displays a table that lists the purposes of the alarm. The table headers represent the intent of the alarms. The table rows display the strategies.
USM Anywhere includes the [MITRE ATT\&CK Dashboard](https://cybersecurity.att.com/documentation/usm-anywhere/user-guide/dashboards/mitre-att-ck.htm) to display MITRE ATT\&CK information.
## The Alarm Strategies by Intent View
The Alarm Strategies by Intent view displays a table that lists the purposes of the alarm. The table headers represent the intent of the alarms. The table rows display the strategies.