> ## Documentation Index
> Fetch the complete documentation index at: https://docs.levelblue.com/llms.txt
> Use this file to discover all available pages before exploring further.
# Create a Configuration Issues Report
Role Availability | ❌ Read-Only ✔️ Investigator ✔️ Analyst ✔️ Manager
You can create a PDF or CSV report of the configuration Issues directly from the configuration issues page.
LevelBlue recommends Google Chrome as the preferred browser for generating reports. The use of alternative browsers may result in poor formatting.
**To create a console user events report**
1. Go to **Console User Events**.
2. You can use filters to define the console user events content you want to display in your report.
 3. Click **Generate Report** to open the Configure Report dialog box.
The filters selected and displayed for the page view are the ones that are populated in the report.
4. Click **Edit Filters** if you want to modify the selected filters, and then click **Continue to Filters**. Do the modifications you need, and then click **Edit Report**.
5. Click the Date field if you want to choose a different date range
3. Click **Generate Report** to open the Configure Report dialog box.
The filters selected and displayed for the page view are the ones that are populated in the report.
4. Click **Edit Filters** if you want to modify the selected filters, and then click **Continue to Filters**. Do the modifications you need, and then click **Edit Report**.
5. Click the Date field if you want to choose a different date range
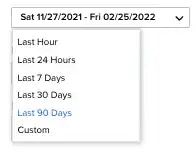 Choose **Last Hour**, **Last 24 Hours**, **Last 7 Days**, **Last 30 Days**, **Last 90 Days**, or **Custom** to set a particular date range.
This option is not available when generating reports for assets or asset groups.
6. Under the Format section, select either **CSV** or **PDF** for the format of the report.
7. Select if you want to generate the report again, and then choose **Never**, **Daily**, **Weekly**, **Bi-weekly**, or **Monthly**.
8. Enter an email address to send the report.
Choose **Last Hour**, **Last 24 Hours**, **Last 7 Days**, **Last 30 Days**, **Last 90 Days**, or **Custom** to set a particular date range.
This option is not available when generating reports for assets or asset groups.
6. Under the Format section, select either **CSV** or **PDF** for the format of the report.
7. Select if you want to generate the report again, and then choose **Never**, **Daily**, **Weekly**, **Bi-weekly**, or **Monthly**.
8. Enter an email address to send the report.
Select the **Send to my Email Address** option to add your email automatically.
9. Select the **Enable Link Expiration** option. This link is delivered by email and expires in 14 days.
10. Click **Next**.
11. In the Report Name field, enter a name for the report.
This name will be displayed in the Saved Reports page.
12. (Optional.) Add a description that will be included.
13. Under the *Number of records* section, choose the maximum number of records to include on the report. For CSV the options are **20**, **50**, **100**, **500**, **1000**, or **50 K**. For PDF the options are **20**, **50**, **100**, **500**, **1000**, or **2500**.
14. If you have chosen the PDF format, you will see the Graphs section, which you can use to include additional views.
You can add or remove graphs included in the report by clicking the  and
and  icons.
15. Select **Save & Run** if you wish to keep the report in your [Saved Reports on USM Anywhere](/documentation/usm-anywhere/user-guide/reports/saved-reports) page and receive the report in the indicated email.
16. Click **Run** to run the report.
icons.
15. Select **Save & Run** if you wish to keep the report in your [Saved Reports on USM Anywhere](/documentation/usm-anywhere/user-guide/reports/saved-reports) page and receive the report in the indicated email.
16. Click **Run** to run the report.