> ## Documentation Index
> Fetch the complete documentation index at: https://docs.levelblue.com/llms.txt
> Use this file to discover all available pages before exploring further.
# Microsoft ATA Dashboard
| | | | | |
| --------------------- | ------------- | ---------------- | ----------- | ----------- |
| **Role Availability** | **Read-Only** | **Investigator** | **Analyst** | **Manager** |
The widgets might be visible in the Microsoft Advanced Threat Analytics (ATA) dashboard if there are Microsoft Advanced Threat Analytics events.
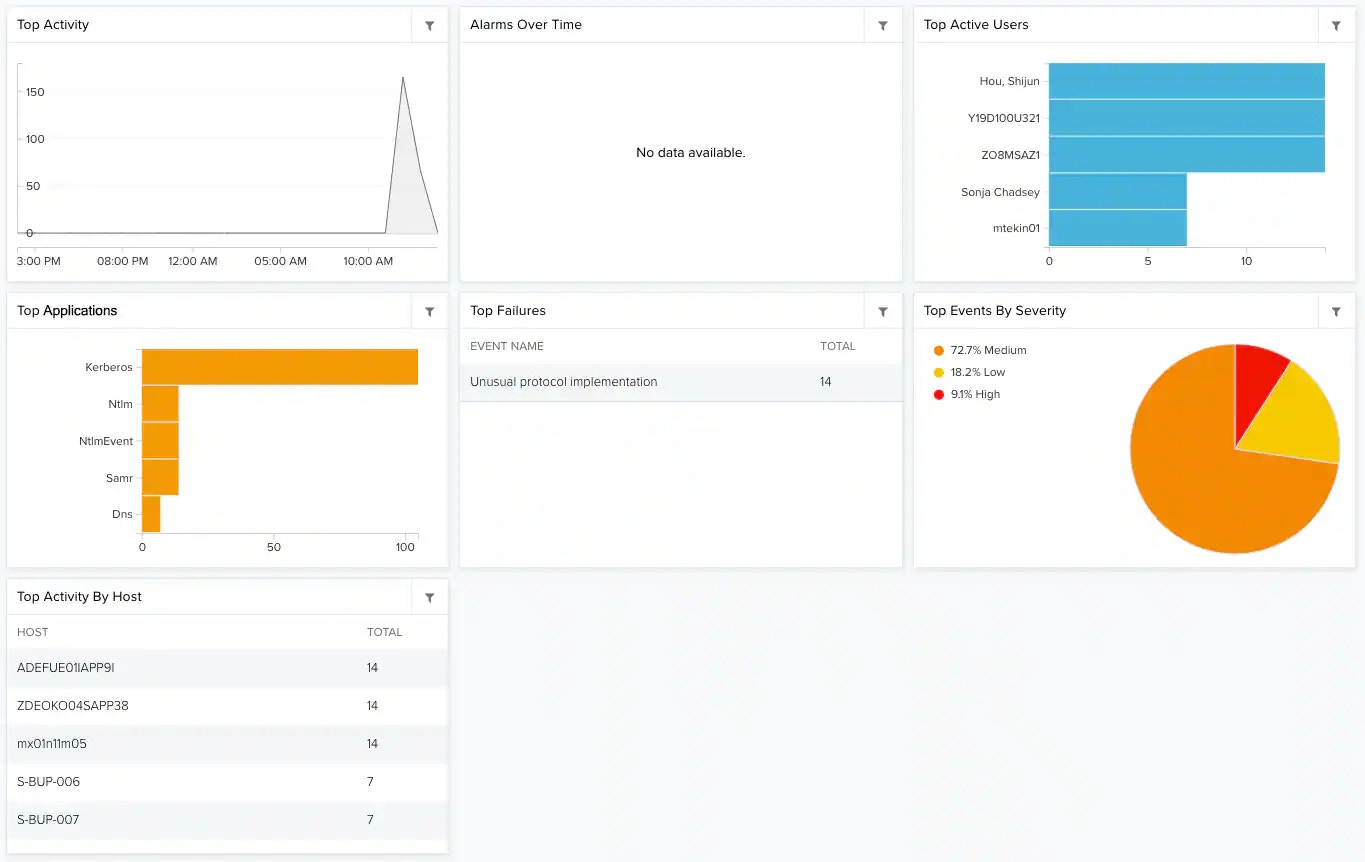 **Widgets in Microsoft ATA Dashboard**
| **Widget** | **Description** |
| ---------------------- | -------------------------------------------------------------------- |
| Top Activity | Graph that shows the number of events over a period of time. |
| Alarms Over Time | Graph that shows the number of alarms over a period of time. |
| Top Active Users | List of the Microsoft ATA top active users. |
| Top Applications | List of the ten top applications detected in the events. |
| Top Failures | List of the Microsoft ATA top failures. |
| Top Events by Severity | Pie chart containing percentage of Microsoft ATA events by severity. |
| Top Activity by Host | List of the Microsoft ATA top activity by host. |
**Widgets in Microsoft ATA Dashboard**
| **Widget** | **Description** |
| ---------------------- | -------------------------------------------------------------------- |
| Top Activity | Graph that shows the number of events over a period of time. |
| Alarms Over Time | Graph that shows the number of alarms over a period of time. |
| Top Active Users | List of the Microsoft ATA top active users. |
| Top Applications | List of the ten top applications detected in the events. |
| Top Failures | List of the Microsoft ATA top failures. |
| Top Events by Severity | Pie chart containing percentage of Microsoft ATA events by severity. |
| Top Activity by Host | List of the Microsoft ATA top activity by host. |