> ## Documentation Index
> Fetch the complete documentation index at: https://docs.levelblue.com/llms.txt
> Use this file to discover all available pages before exploring further.
# Viewing Event Details
The event details page provides in-depth information on events.
**To view the details of an event**
1. Go to **Activity > Events**.
2. Click the event to display a summary view, then click the event name to open the full details of the event.
 Click the
  icon to bookmark an item for quick access.
**Note:** You can view your bookmarked items by going to the secondary menu and clicking the icon. This will display all of your bookmarked items and provide direct links to each of them.
The Event Details page includes event management functions that are supported for your assigned user role:
* **Select Action**: See [Applying Actions to Events](actions-to-events) for more information.
* **Create Rule**: See [Creating Rules from Events](creating-rules-from-events) for more information.
* **Generate Report**: This option displays if you have opened the full details of the event. See [Create an Events Report](exporting-events) for more information.
The event details include the main fields that identify an event. Keep in mind that you can edit or add values into this field:
* **Investigation**: This field indicates if the event has been associated to an investigation. You can click the
icon to bookmark an item for quick access.
**Note:** You can view your bookmarked items by going to the secondary menu and clicking the icon. This will display all of your bookmarked items and provide direct links to each of them.
The Event Details page includes event management functions that are supported for your assigned user role:
* **Select Action**: See [Applying Actions to Events](actions-to-events) for more information.
* **Create Rule**: See [Creating Rules from Events](creating-rules-from-events) for more information.
* **Generate Report**: This option displays if you have opened the full details of the event. See [Create an Events Report](exporting-events) for more information.
The event details include the main fields that identify an event. Keep in mind that you can edit or add values into this field:
* **Investigation**: This field indicates if the event has been associated to an investigation. You can click the  icon to edit the field and enter the title or the number that identifies each investigation. See [Adding an Event to an Investigation](investigation) for more information.
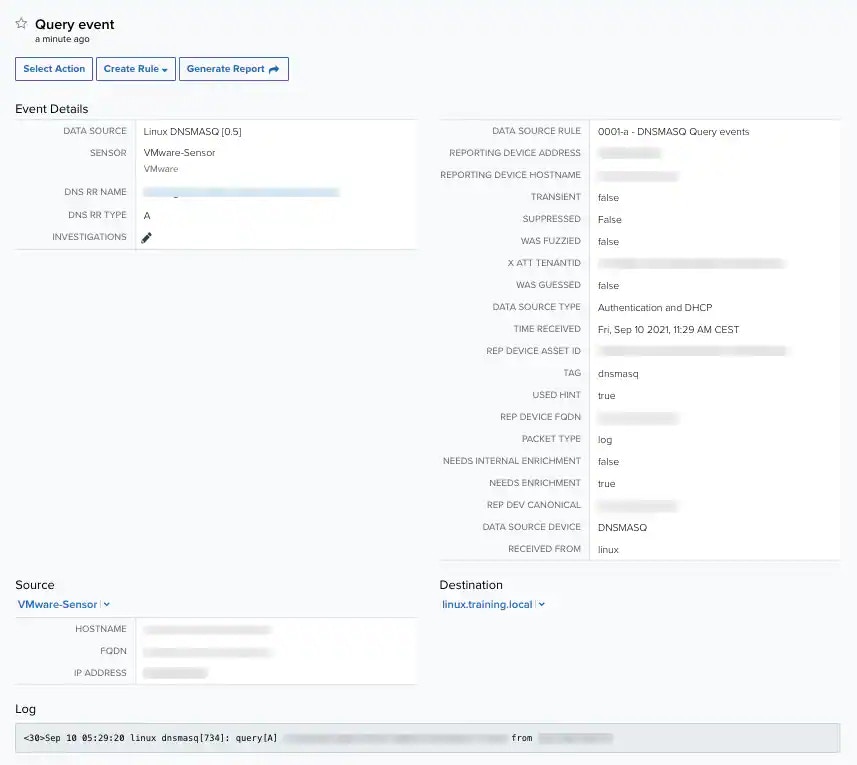
You can see the event details, then the source, the destination, the source and destination users, the payload, and the log. The
icon to edit the field and enter the title or the number that identifies each investigation. See [Adding an Event to an Investigation](investigation) for more information.
You can see the event details, then the source, the destination, the source and destination users, the payload, and the log. The  icon located next to the Source, Destination, and two User fields enables you the access to several options. See [Events List View](events-list-view) for more information about those options.
In addition, you have these three options:
* **Add to current filter**: This option enables you to add the asset to the selected filters.
* **Look up in OTX**: This option searches the IP address of the source asset in the LevelBlue Open Threat Exchange (OTX™) page. See [Using OTX in USM Anywhere](../otx/using-otx-in-anywhere) for more information.
* **Add asset to system**: Use this option to create the asset, see [Adding Assets](../asset-management/asset-administration/adding-assets) for more information.
**Note:** The value in the FQDN field comes from the event itself (raw log). This field can have a real FQDN, an IP address, or be empty.
3. In the upper right corner, click **Previous** and **Next** to navigate between items.
4. Click the
icon located next to the Source, Destination, and two User fields enables you the access to several options. See [Events List View](events-list-view) for more information about those options.
In addition, you have these three options:
* **Add to current filter**: This option enables you to add the asset to the selected filters.
* **Look up in OTX**: This option searches the IP address of the source asset in the LevelBlue Open Threat Exchange (OTX™) page. See [Using OTX in USM Anywhere](../otx/using-otx-in-anywhere) for more information.
* **Add asset to system**: Use this option to create the asset, see [Adding Assets](../asset-management/asset-administration/adding-assets) for more information.
**Note:** The value in the FQDN field comes from the event itself (raw log). This field can have a real FQDN, an IP address, or be empty.
3. In the upper right corner, click **Previous** and **Next** to navigate between items.
4. Click the  icon to close the dialog box.