> ## Documentation Index
> Fetch the complete documentation index at: https://docs.levelblue.com/llms.txt
> Use this file to discover all available pages before exploring further.
# USM Anywhere System Monitor
| | | | | |
| --------------------- | --------- | ------------ | ------- | ----------- |
| **Role Availability** | Read-Only | Investigator | Analyst | **Manager** |
The USM Anywhere System Monitor page enables the user whose role is manager to display statistics of the data coming from sensors inside a time-frame. See [Role-Based Access Control (RBAC) in USM Anywhere](/documentation/usm-anywhere/user-guide/user-management/rbac) for more information.
You can choose between the last 24 or 7 hours. If you have more than one sensor configured in your environment, you need to select a sensor.
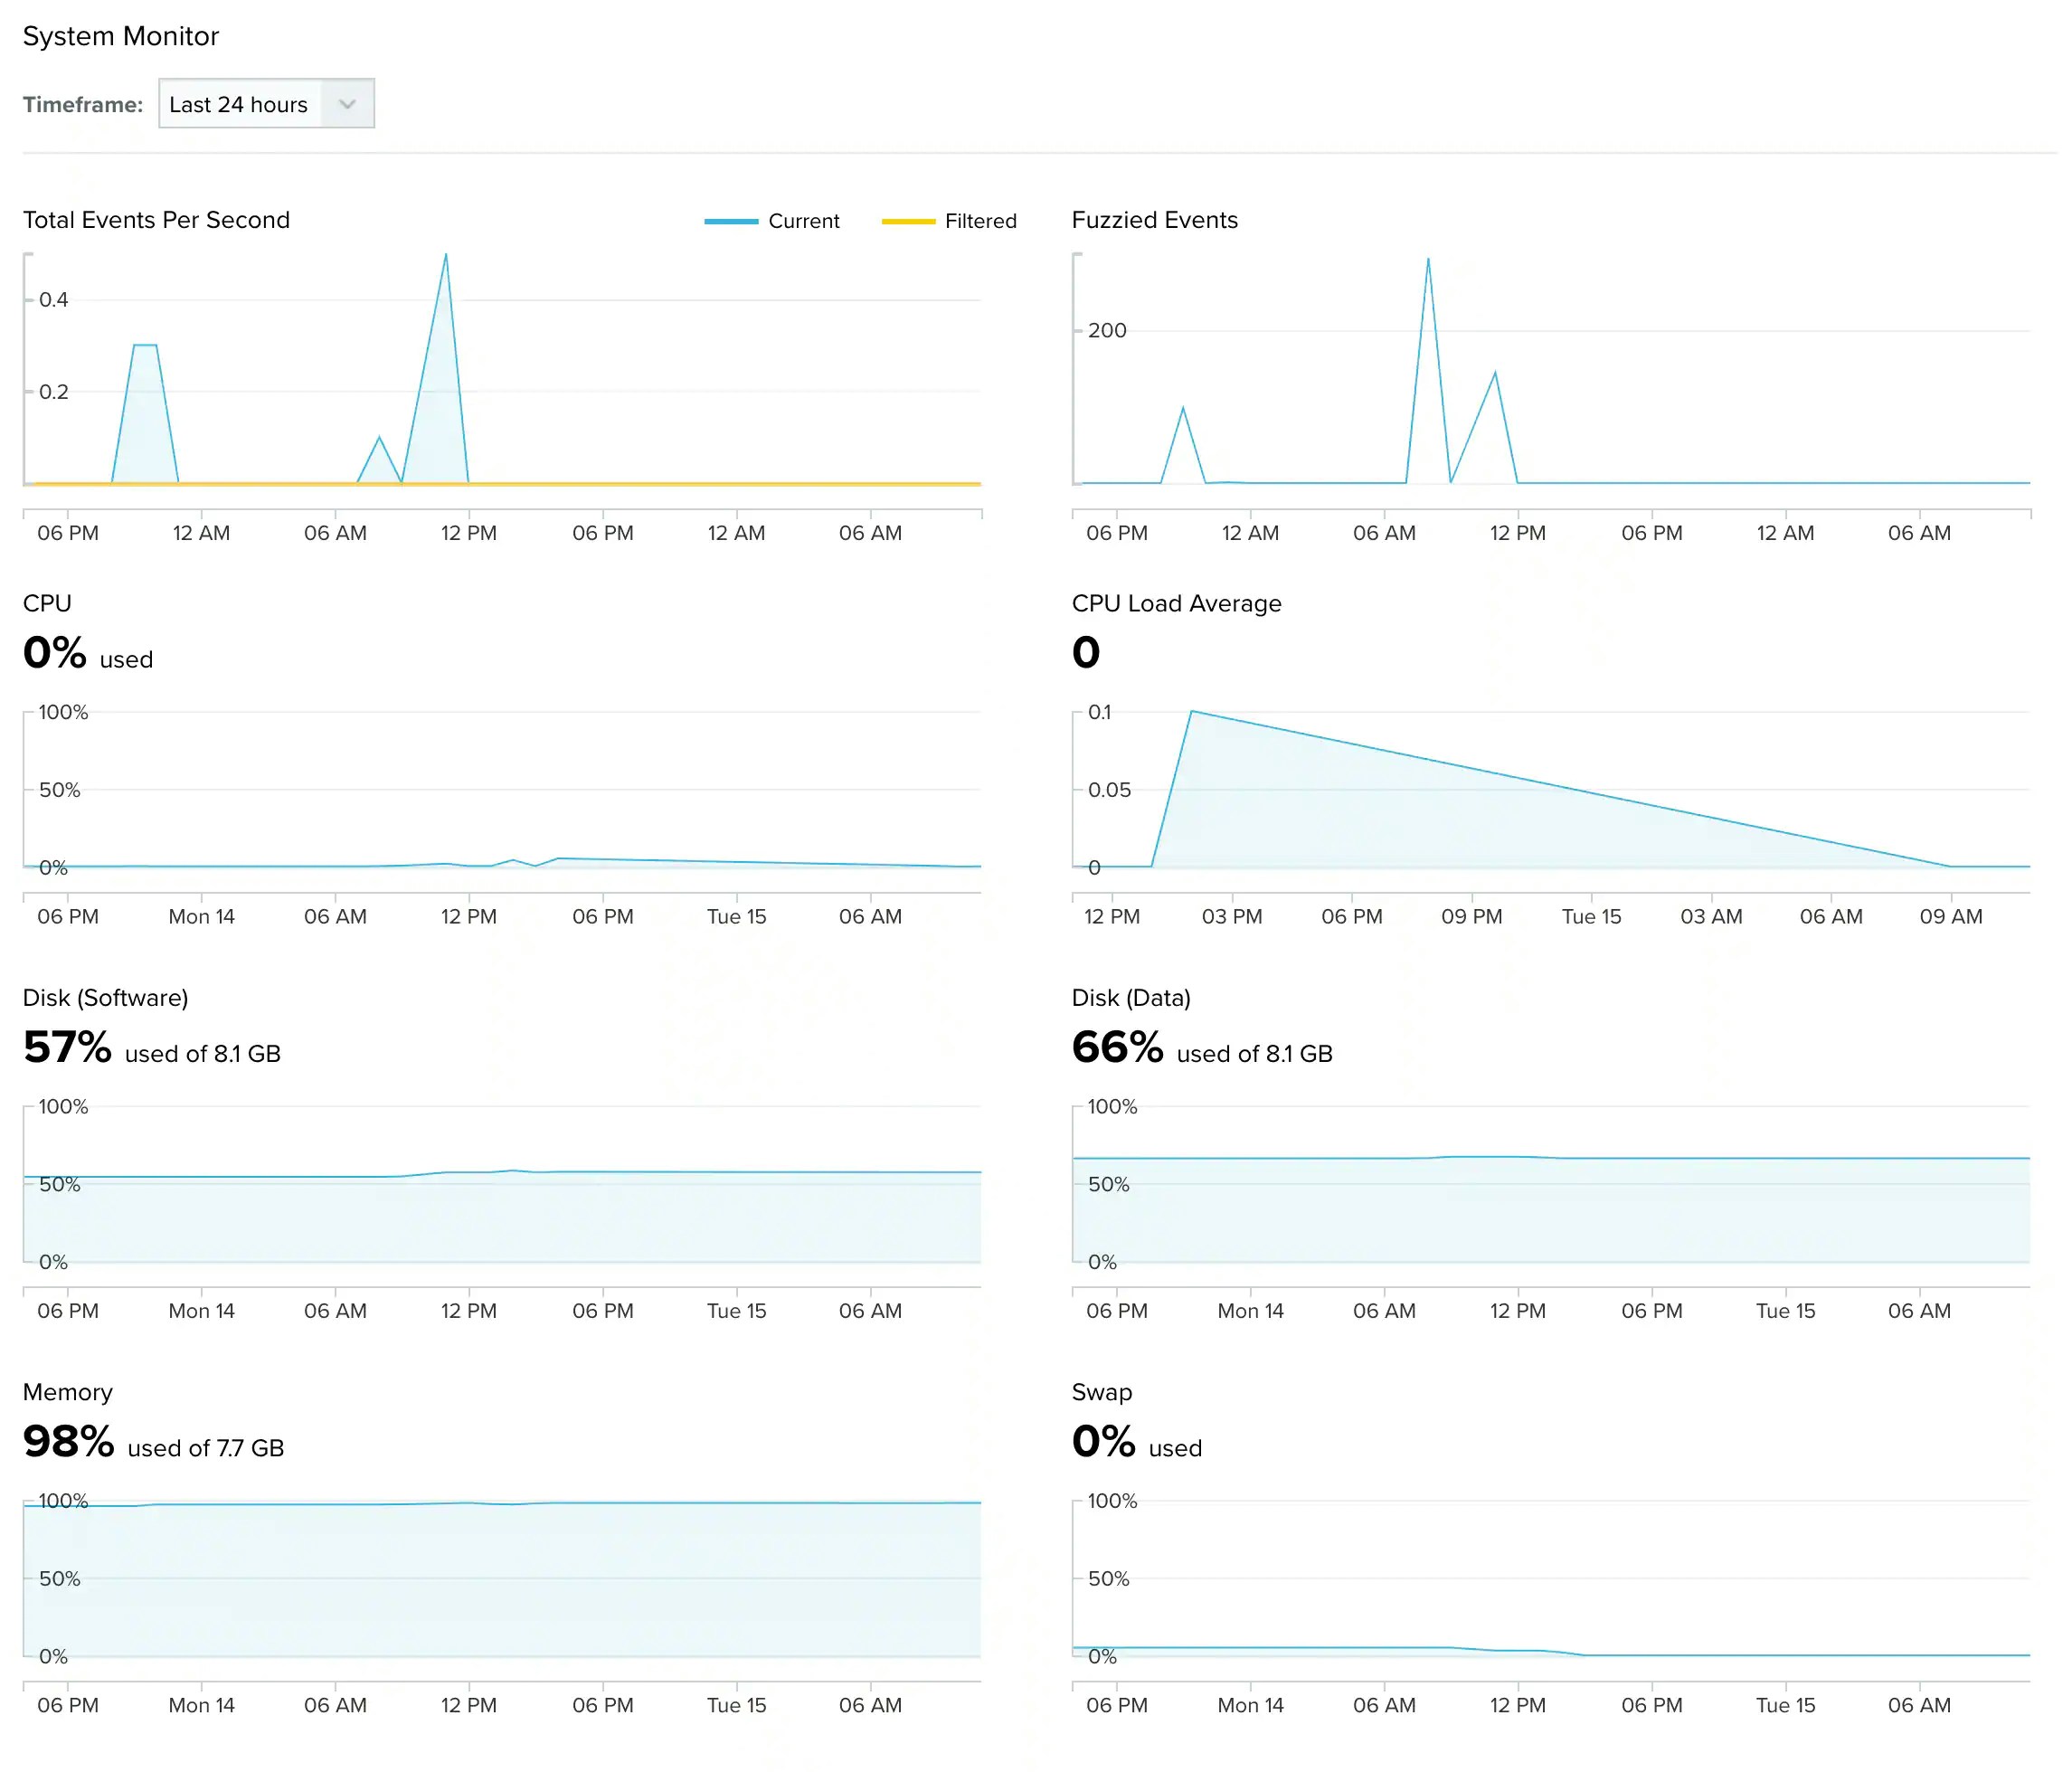
Go to **Settings > System**, and then click **System Monitor** in the left navigation panel. These are the displayed data:
 **System Monitor Fields**
| Field | Description |
| ----------------------- | --------------------------------------------------------------------------------------------------------------------- |
| Total Events Per Second | Graph displaying the total events received per second. (You can see the current and the filtered events.) |
| Fuzzied Events | Graph displaying the total fuzzied events received per second. See About the Was Fuzzied Filter for more information. |
| CPU | Graph displaying in percentages the total CPU used. |
| CPU Load Average | Graph displaying the load average of the CPU. |
| Disk (Software) | Graph displaying in percentages the total disk (software) used. |
| Disk (Data) | Graph displaying in percentages the total disk (data) used. |
| Memory | Graph displaying in percentages the total memory used. |
| Swap | Graph displaying in percentages the total swap used. |
**System Monitor Fields**
| Field | Description |
| ----------------------- | --------------------------------------------------------------------------------------------------------------------- |
| Total Events Per Second | Graph displaying the total events received per second. (You can see the current and the filtered events.) |
| Fuzzied Events | Graph displaying the total fuzzied events received per second. See About the Was Fuzzied Filter for more information. |
| CPU | Graph displaying in percentages the total CPU used. |
| CPU Load Average | Graph displaying the load average of the CPU. |
| Disk (Software) | Graph displaying in percentages the total disk (software) used. |
| Disk (Data) | Graph displaying in percentages the total disk (data) used. |
| Memory | Graph displaying in percentages the total memory used. |
| Swap | Graph displaying in percentages the total swap used. |