

Formatting Conventions
This manual uses the following formatting conventions to denote specific information.Notes, Tips, and Cautions
Note: This symbol indicates information that applies to the task at hand.
Introduction
DbProtect is a data security platform for data stores, including relational databases and Big Data. Supported databases include on-premises and cloud services. DbProtect uncovers conditions that could lead to escalation of privileges attacks, data leakage, denial-of-service (DoS), or unauthorized modification of data. The conditions checked include database configuration mistakes, identification and access control issues, missing patches, and other settings. DbProtect provides multi-user/role-based access, highly scalable distributed architecture, and enterprise level analytics. DbProtect enables organizations to secure their relational databases, document databases and Big Data stores throughout their environment, on premises or in the cloud. This guide introduces the interface and components within DbProtect.Document Audience
This guide is intended for personnel using DbProtect on a day-to-day basis. It provides the detailed instructions necessary to complete all administrative and user workflow tasks. This guide does not include instructions for the installation or upgrade of the software components, licensing, network access, or the setup and configuration of databases. System Administrators: refer to the DbProtect Install and Upgrade Guide for detailed instructions on how to install/upgrade DbProtect and prepare it for use on your network. If DbProtect installation and setup have been completed by LevelBlue personnel, refer to your organization’s DbProtect Run Book for customized day-to-day operational procedures developed and documented specifically for your organization.Note: Customized DbProtect Run Books are developed for customers as part of a paid Consulting & Professional Services engagement. Please contact your Account Manager or your LevelBlue Sales Professional for more information.
DbProtect Components
A DbProtect installation includes a console server and one or more scan engines. DbProtect has two interfaces: DbProtect Core (legacy) and DbProtect Explorer (new).Scan Engines
DbProtect vulnerability management scan engines discover databases within your infrastructure and assess their security strength. Backed by a proven security methodology and extensive knowledge of application-level vulnerabilities, DbProtect locates, examines, reports, and helps users operationalize security holes and misconfigurations. Scan engines scan your database instances for vulnerabilities and allow you to perform Pen Tests and Audits against them.Sensors
Sensors deliver database-specific monitoring and alerting for best-in-class protection of enterprise organizations. You can fine-tune your event detection parameters and customize which audit and security events are monitored by DbProtect. This helps you focus security efforts on relevant information, while bypassing false positive and irrelevant events.DbProtect Core
DbProtect Core is a web-based application facilitating navigation across various features, offering essential services for scanning, reporting, and data warehousing management.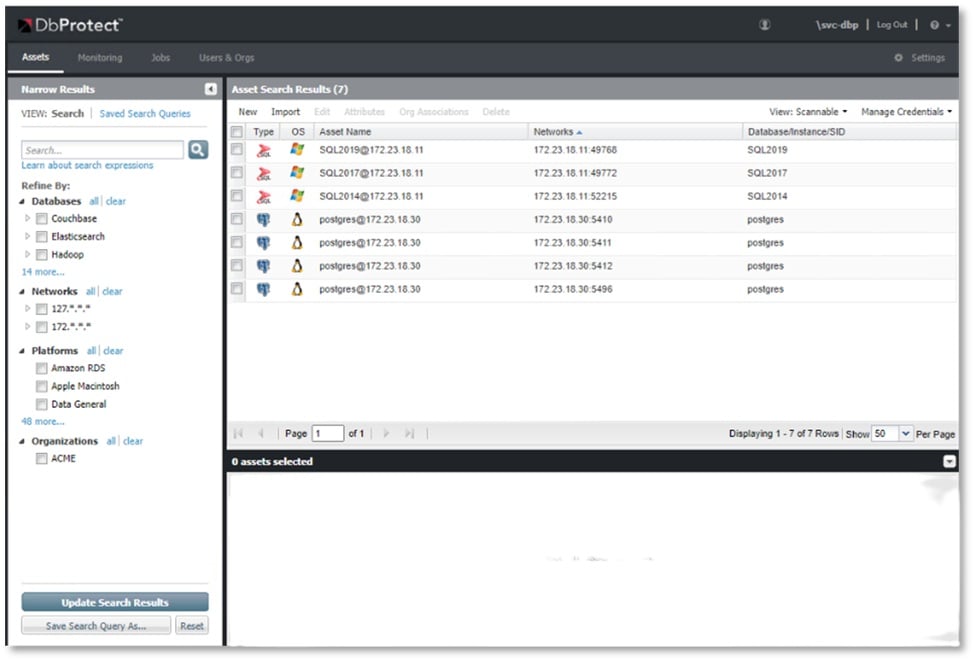
DbProtect Explorer
The DbProtect Explorer sits on top of all your existing and ongoing DbProtect data and settings. DbProtect Core and DbProtect Explorer users will see and access the same data, and activities performed in one console are reflected in the other. Although the DbProtect Explorer user interface currently applies only to the Dashboard, Alerts, and Exploration components in the release, all the existing components of DbProtect Core are available through links in the navigation pane on the left side of the DbProtect Explorer.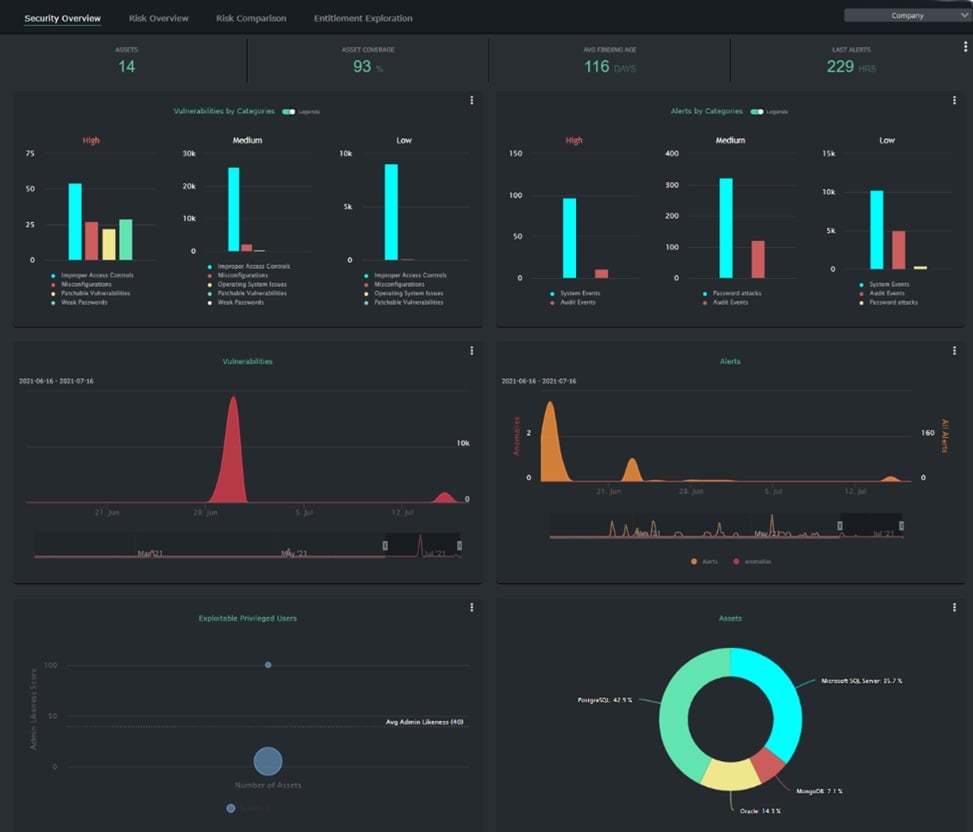
Use Single Sign-on (SSO) to access DbProtect
For single sign-on (SSO) to function properly, you may need to configure your browser by adding the DbProtect URL to your list of trusted intranet sites.Permissions and Prerequisites
To use DbProtect successfully, you must allow specific network access and user permissions.Network Access for DbProtect Components
DbProtect components communicate on the network ports listed in the table below. For full details of required access, see the DbProtect Installation Guide and Getting Started Guide.User Permissions and Network Access for Target Assets
DbProtect scanning and auditing jobs require specific access to the Operating Systems and databases scanned. A summary of the requirements is included in Appendix B: User Account Privileges Needed for Audit and User Rights Review Scans. For the latest information about required access (including scripts to set required values), see the Readme file installed with the current SHATTER Knowledgebase. You can find the Readme file in the File Cabinet portal. DbProtect installs by default in the following location:Log in to DbProtect Core
To use a browser to connect to DbProtect Core:- Enter
https://[ConsoleServer]:[Port]in the address line, where:[ConsoleServer]is the hostname or IP Address of DbProtect Core server[Port]is the port number where DbProtect Core Management Server has been configured to provide service. The default port as installed is 20080 (e.g.,https://DbProtect_server:20080).
- A Security Alert message may be displayed, warning you of an invalid security certificate. You can safely continue past this message. DbProtect uses a self-generated SSL certificate by default to encrypt communications.
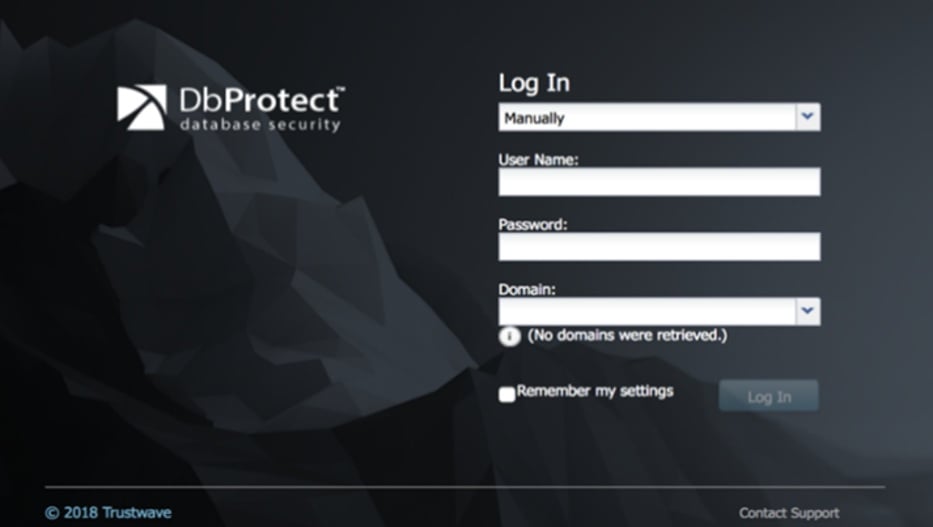
- From the Log In menu, select Use Windows Authentication or Manually.
- If you select Use Windows Authentication, DbProtect uses your Windows login credentials to log on to DbProtect.
- If you select Manually, you are prompted to enter your login credentials.
- In the Username field, enter your DbProtect username. You can also enter the domain information in this field in usual Windows formats such as
domain\username. - In the Password field, enter the password that matches the username.
- Use the Domain menu to select the domain for the username or manually enter a domain in this field.
- Click Log In. If the credentials you entered are valid, DbProtect Core opens.
DbProtect Explorer
The DbProtect Explorer sits on top of all your existing and ongoing DbProtect data and settings. DbProtect Core and DbProtect Explorer users will see and access the same data, and activities performed in one console are reflected in the other. Although the DbProtect Explorer user interface currently applies only to the Dashboard, Alerts, and Exploration components in the release, all the existing components of DbProtect Core are available through links in the navigation pane on the left side of the DbProtect Explorer.Troubleshooting Your DbProtect Core Login
If you have trouble logging on to the DbProtect Core, you may need to troubleshoot your security settings or change your browser configuration.- In Control Panel | Internet Options | Advanced, if Integrated Windows Authentication is enabled the Windows user will be automatically authenticated, if possible, in modern browsers that are configured properly.
- Ensure that JavaScript is enabled in the browser.
- DbProtect Core provides basic functionality in current versions of major browsers. You may see slight variations in the presentation of pages between browsers.
- When there is no activity on your machine for a specified period of time, you will be logged out. You must log in again by returning to the Login screen.
Familiarize yourself with DbProtect
DbProtect Core is the primary user interface for DbProtect.Navigating DbProtect Core
For a typical view of the basic DbProtect Core screen layout, see DbProtect Core. The upper right portion of the screen shows the Account ID of the logged-in user, Help and New Feature information, and the Log Out link. Many panes of the console show data in lists. Common tools for list views include:Select an organization
In several locations throughout DbProtect Core, the data displayed is based on the specific organization selected at the top right of the content pane. To change the organization:- Click Change Organization. The Report Viewing Organization Selector dialog opens.
- Click the expand or collapse controls to expand or collapse the tree view of descendant organizations.
- Select an Organization. For reports, you can choose to include all descendant organizations of the selected organization.
- Choose to apply the selection to reporting, or only to the part of DbProtect Core where you opened this window.
- Click OK to apply your selections.
Pages in DbProtect Core
The DbProtect Core taskbar on the upper part of the page allows you to access all the functions of DbProtect Core through “pages.” Depending on the permissions of the currently logged-in user, and your organization’s specific licensing, some pages may not display.Assets
The Assets section of DbProtect Core allows you to create, view, and manage assets in the DbProtect repository. Assets include scannable database instances, and redirectors. You can add database instance entries manually, import entries from a file, and edit existing entries. You can also search the list of known assets by criteria such as database type and network location.- To scan for database instances and add them to the asset list automatically, use a Discovery Job (see Add assets for more information).
Note: User access to add, view, and manage assets depends on the user’s role (permissions) for the DbProtect Core application, and for the organization that an asset is associated with.
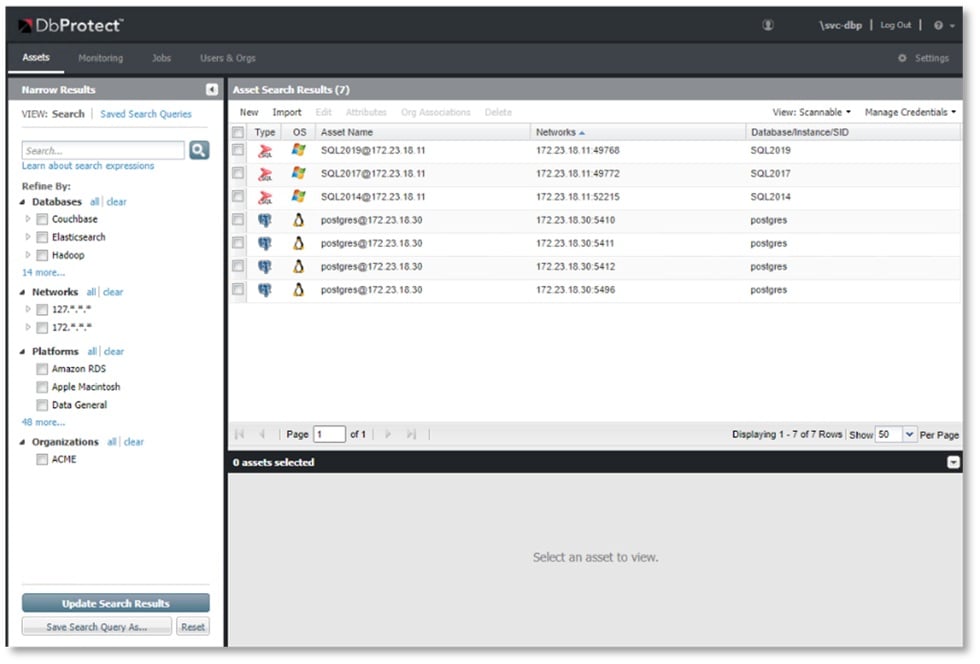
- By default, the asset list only shows scannable assets. Click the View menu at the top right of the Asset Search Results pane to see all assets.
- Sort and filter the list using standard tools (see Navigating DbProtect Core).
- Search for specific assets (see Search assets for more information).
Monitoring
The Monitoring page allows you to edit monitoring policies for databases and set up real-time monitoring and alerting based on those policies. For more information, see Set up basic monitoring.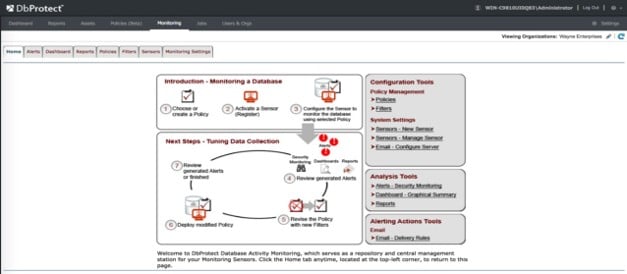
Note: User access to set up monitoring of assets depends on the user’s role (permissions) for the DbProtect application, and for the organization that an asset is associated with.
- To select the organization you want to work with, click Change Organization (top right of the page).
- The Monitoring page uses a set of navigation tabs that allow you to configure and review monitoring for the various pages of the DbProtect taskbar.
For more information about how to set up monitoring on each of these tabs, see Advanced Monitoring.
Jobs
The Jobs page allows you to create testing and review activities for a database instance or group of instances and run these activities on demand or on a schedule. For more information, see Jobs workflow.Note: User access to Jobs depends on the user’s role (permissions) for the DbProtect application, and for the organization that an asset is associated with.
Note: The steps for running jobs differ depending upon the type of job you run, and the type of assets (databases) being scanned.
Report DbProtect results
The Reports section of DbProtect Core allows you to generate, view, save, and schedule detailed information on security metrics, job operations, assets, administration, vulnerabilities, rights, policies and more. The Reports page of DbProtect Core has two sub-sections: On Demand and History.Note: User access to Reports depends on the user’s role (permissions) for the DbProtect application, and for the organization that an asset is associated with.
- Click Reports | Catalog.
- Select one of the built-in on-demand reports. A new browser window/tab will open where the generated report will be displayed.
- Click Reports | History.
- Scroll through the list of reports that have already been generated. These are reports that have been run as part of an executed job, whether set up as a one-time or scheduled job.
- Select the checkbox next to the report that you want to view.
- Click the PDF document link for the report (right side) and save the report to your computer.
- Navigate to the file and double-click to open.
Users & Orgs
The Users & Orgs page is where you create “organization” containers for permission purposes, assign users (or user groups) to those organizations, and associate policies to the organizations. You can assign roles to users to manage user permissions more easily.Organizations tab
Typically, an “organization” is a group of servers that have similar reporting requirements based on geographical location, line of business, database type, regulatory environment, and/or any other segregation of assets required for reporting purposes. Organizations can also be used to create a multitenancy configuration, so a single DbProtect Core can serve multiple business entities, while strictly enforcing segregation of duties, assets, access, and results. The Organizations tab shows the following:- The top pane lists the organizations set up in DbProtect.
- The bottom pane provides details of the organization selected on the top pane, on four tabs:
- Use the paging controls below the list to view more items.
- If an organization has dependents, click the arrow next to the name to expand the dependent list. You can also use the expand and collapse buttons at the top right of the list to view or hide the dependent organizations.
Users tab
DbProtect users are imported from Microsoft Active Directory or from the local server where DbProtect Core is installed. Both users and groups can be imported. Users can be granted a set of roles within the product. All DbProtect functions are restricted by role-based access. Access to each function is controlled by permissions that are granted to the user through a role. The typical users of the product have been separated into two groups: system and organization. These groups mirror the typical scopes of access control in most environments. The Users tab displays the following:- The top pane lists users and groups. If there are many entries, you can view them using the corresponding navigation arrows below the list.
- The bottom pane lists the roles and effective permissions of the selected user or group.
Settings
The Settings page (on the right side of the DbProtect taskbar) allows you to review system performance, manage licensing, email settings, and manage scan engine registrations. For more information, see Modify System Settings.Navigating in DbProtect Explorer
All navigation within DbProtect Explorer is initiated through the navigation pane on the left side of the browser window.Organization Selector
If your company has a hierarchy, and you have been assigned the necessary role to access the various organizations in the hierarchy, the ability to change between Organizations will be visible in the top-right of the DbProtect Explorer pages. Select the organization whose data you want to see reflected in the Dashboard, Alerts, or Policies pages. You can move between organizations and levels, as desired to change the data displayed.DbProtect Explorer Dashboard
The DbProtect Explorer Dashboard provides different ways to look at your security and risk positions:- Hover over legend items to highlight specific bars.
- Click the Legends slider button to show or hide chart legends.
- Hover over the chart bars or graphs to display data related to the vulnerabilities or alerts.
- Click a bar or graph line to open the item and display the finding’s details and set display and filter options for the chart/graph.
The Security Overview tab of the Dashboard gives you a quick breakdown of alerts and findings activity and risk, exploitable users, and asset categorization, inventory, and scanning coverage. These initial charts offer convenient high-level views of your DbProtect data, with easy access to underlying data.
- Vulnerabilities & Alerts by categories: Organized from High to Low risk, these charts allow you to target vulnerability and asset categories that are at highest risk of producing high numbers of findings or alerts. Hover over the bars to see the category name and number of findings or alerts for the category.
- Vulnerabilities and Alerts over time: See the trends of findings and alerts over time to help pinpoint specific events or changes in your system configurations that increased vulnerability internally, or that represent increased external activity against your networks and databases. Slide the shaded Viewer on the bottom graph line to extend the viewable timeframe beyond the last 30 days.
- Asset Categories, Coverage, and Inventory: The number of assets currently registered in DbProtect, and the number of assets currently covered by scanning activity are shown at the top of the screen. The categorization of your asset inventory is shown in a donut chart to provide a snapshot of the percentage of your inventory in each asset type (database types). Click a segment of the chart to see asset tags on the right side; the segment pops out of the donut to highlight that portion of the inventory for presentations or discussion.
Filtering and Generating Reports
When you browse through the data on the dashboards, there are options available to allow you to display the data, export the data as a report, or to create a report job.Filtering
On the Explorer Dashboard, the ability to filter the data is available to quickly search for and access the data that is of the most interest. On any of the report drill-throughs, the filter header will be displayed. The data displayed can be further filtered by Asset Type, Check Category Type, Risk, Date Range, and Status. In addition, it can display information from any child organizations that exist under the current organization. Advanced options are available to further refine the results and allow for multiple conditions to be specified. After the criteria is specified for filtering, clicking Apply will refresh the displayed data. The filters and conditions applied here will apply to the options available under the Advanced Monitoring capabilities.Report
When the Report option is selected, the ability to export the data in either PDF, HTML, CSV, or XML is available. By applying filter and condition criteria, as explained in Filtering, the data can be focused in on what matters the most. When the Create Report button is clicked, a preview of the report will display to confirm the data before it is saved.Job
To create a report job out of the filtering applied, the Job button can be selected. Here, the same ability to filter is available; although there are different conditions that can be applied. The conditions under the Job option allow the data to be filtered based on Asset and/or Check criteria. After selecting the filters and clicking the Create Job button, an additional dialog opens. In this dialog, the report format can be selected, and a report filter is displayed. The report filter can be saved as a shortcut to generate a particular report and filter options which can be added to the report in either an Audit Job or a Report Job.Alerts
DbProtect Explorer displays alerts differently from DbProtect Core in several ways:- Adding archived or acknowledged alerts to the list of active alerts is only a button click; you do not have to view archived and current alerts separately and move between tabs to see them.
- You can quickly adjust the risk level to filter the displayed items to High, Medium, or Low, and see alerts from the last 30, 60, or 90 days.
- Multiple filter conditions can be applied to the list at any given time, allowing you to filter down the results as needed to quickly find alerts for specific assets or of particular types. Filters can be set for “contains” or “does not contain” criteria.
- Initial information about a selected alert is displayed in the bottom pane of the page, and more detailed information is available by double-clicking the alert in the list.
- The Anomalies tab displays specialized alerts generated by the occurrence of anomalous activity (non-standard usage and access patterns).
Policies
This view shows what policies are available. These can then be viewed, and custom policies can be created (Navigation pane | Management | Policies) in DbProtect Explorer.- The Policies page defaults to the Policies Overview tab, where you can create a new policy or search existing policies and checks.
- Click the Policy List tab to display a list of the policies available, create new policies, edit or duplicate an existing policy, and import or export a policy.
- Double-click the policy you want to view, and a new slider will open from the right-side of the screen, displaying the results of the checks performed by the policy.
- View details of any policy, including Risk Level and Knowledgebase information.
- Click Save As on a built-in policy to save the policy under another name and make it editable.
Exploration
Visualization of your DbProtect data (including users, assets, alerts, and vulnerabilities) and how their relationships are managed (rules, checks, and permissions) are available through the Exploration page of DbProtect Explorer. Expand the nodes of the network to see how DbProtect Explorer aggregates, visualizes, and makes your data accessible to you, allowing you to discover and pursue areas of vulnerability and risk that might not be obvious when looking at charts and graphs alone.Exploration page navigation controls
After you have expanded multiple levels of nodes, you may want to zoom in or out, move the network around to look at different areas, close some nodes to focus on a particular area, or change the data being visualized. Navigation in the Exploration page is easily managed from the controls on the left side of the page.Use the Exploration Scratchpad
As you expand the nodes in your system, you will start to see areas that require attention, and that you might want to look at in more detail or investigate at a later time. Use the Scratchpad to capture nodes of interest, with the underlying data, so that you can pursue specific areas of vulnerability or risk with the details you need to close gaps in your system. Any node with a white halo can be added to the Scratchpad. To use the Exploration Scratchpad:- Hold down the shift key while clicking a node with a white halo. The node will appear in the Scratchpad slider at the top right of the Exploration window.
- Hover over the Scratchpad slider to expand it out into the page and view a list of the nodes you have added.
- Click either the Exploration Scratchpad header, or an item in the list, to open the Scratchpad in a new browser tab.
- Click the arrow next to the node Type to expand the individual nodes and view the underlying data.
Entitlements Exploration
Visualization of your User Rights Review data is available through the Entitlements Exploration page of DbProtect Explorer. Using this page, you are able to drill down into various categories (asset type, objects, users, and privileges.) When you select an asset type it drills down the data for only the selection made, for example, when Microsoft SQL Server is selected. Upon selection of a bubble in the Users category, it will zoom in on what was selected and an information pane with details on the selected information displayed. Additional information can be seen by selecting one of the items displayed. From this view, additional search parameters can be entered to filter the data further. The ability to export the dataset to CSV is also available.Overview of DbProtect workflows
Note: The DbProtect workflows refer to the DbProtect Core only, and all referenced instructions are for functionalities that are only available in DbProtect Core.
- Administrative Setup workflow
- Jobs workflow
Administrative Setup workflow overview
The administrative setup workflow consists of the following steps:- Create organizations
- Add users and assign roles
- Manage policies
- Register scan engines
Create organizations
A DbProtect “organization” contains scannable assets (database servers). Typically, an organization is a group of servers that have similar check requirements based on the server type and/or regulatory environment. As part of initial setup, the administrator will create organizations to reflect the known and expected structure of databases in the enterprise. You can place an asset in one or more organizations. For more information, see Organizations.Add users and assign roles
Once users are granted permissions in the organizations, additional tasks such as asset management, job creation, and reporting can be delegated to the users. As part of the Setup Workflow, an administrator will import additional users and grant role access to them:- Users are accounts that you import from the Windows domain or local machine environment.
- Roles are permission sets that you apply to grant users varying types of permissions within DbProtect. For example, you can allow users permission to:
- View reports for one or more organizations
- Manage or run jobs
- Grant permission to one or more organizations to other users
- Manage the entire installation
View policies
A DbProtect policy is a group of scanning checks. Policies are defined to validate best practices and regulatory, risk, compliance, or database security requirements. DbProtect applies policies to database assets to check configuration, user entitlements, audit and historical activity, and monitor activity in real time. You can customize policies to meet your requirements.Register scan engines
Scan engines are software applications that collect and store data about your network assets. The scan engines must be installed and then registered in DbProtect before DbProtect Core can access the scanners’ data. Scan engines are managed (registered, configured, and unregistered) in the Setting section of DbProtect. See Register a scan engine for more information.Jobs workflow overview
Adding assets
An asset is a scannable database instance or scanning component known to DbProtect. Before you can perform other activities such as setting up jobs, you must add the target database instances as assets. Assets include:- Databases that you scan
- Database related endpoints, such as SQL redirects
- DbProtect scan engines
Set up and run jobs
The Jobs page includes four tabs that allow you to see a list of currently available jobs, as well as information about jobs in progress, completed jobs, and jobs scheduled to run in the future.Discovery jobs
Discovery is the activity of scanning your network to find database assets. Typically, you perform discovery when you are setting up DbProtect, to quickly populate the assets in your environment. You should also perform discovery periodically to scan for new or unknown (possibly unauthorized) data stores. Discovery can also be used to identify assets previously scanned that are no longer on the network. Discovery is performed by jobs that you can run on a schedule, or immediately. The results of jobs are available as reports that you can distribute and review. After initial discovery, you can set up the structure of organizations that allow you to perform further testing. You can also leverage information gathered during discovery to ensure that all discovered assets are accounted for in your organization’s asset management inventory. For more information about Discovery jobs, see Add assets through discovery.Pen test and audit jobs
Pen tests and audits apply policies to validate the security of assets and the data they hold. Pen tests generally investigate the security of data and systems against outside attacks. You can also leverage information gathered during discovery to ensure that all discovered assets are accounted for in your organization’s asset management inventory. Pen tests and audits are performed by jobs that you can run on a schedule or immediately. The job results are available as reports that you can distribute and review. For more information about audit and pen test jobs, see Set up and run a job.Rights review jobs
Rights review jobs perform a check of user permissions over assets and the objects they include such as tables and stored procedures. You can use the output of rights review jobs to understand who has access to assets and how they got those permissions. You can use this information in discussion with application owners to help with setting access control policies. For more information about rights review jobs, see Set up and run a job.Monitor activity
DbProtect database activity monitoring allows you to set up real-time monitoring and alerting for database activity, based on built-in policies or policies that you customize. You can monitor activity for a specific user, column or table, or any combination. Monitoring allows you to watch assets for specific behaviors in real time. You can use monitoring to watch for system problems or malicious activity. You can also use monitoring to record the actions of authorized users and monitor privileged user activity as well. You can forward the results of monitoring to other systems, such as a Security Incident and Event Management (SIEM), Governance, Risk and Compliance (GRC), or a Ticketing system. For more information about Monitoring, see Set up basic monitoring.Report on results
DbProtect provides detailed reporting on the results of scans. One or more reports can be run as part of a pen test or audit job. Reports can also be run as standalone jobs or created on demand. Reports, or notifications of report availability, can be delivered by email to users. For more information on reporting, see Report DbProtect results.Investigation and Remediation
DbProtect is designed to help you learn about the strengths and weaknesses of your database assets. It is up to the organization to review the results of testing. The goal of the review will be to identify items that require action, as well as to validate the appropriate access to assets. This investigation usually requires input from database owners and application developers, as well as the organization’s security team. Based on the investigation of results, the organization will take action to resolve security issues (for example, updating service packs and security policies).Getting started with DbProtect workflows
Administrative Setup workflow
As outlined in Overview of DbProtect workflows, the following provides detailed instructions to perform the basic workflow steps of the Administrative Setup.Create an organization
To create an organization:- Click Users & Orgs on the DbProtect taskbar.
- On the Organizations tab, click New Organization. The Create an Organization dialog opens.
- Type a Name for the organization.
- Choose the Parent Organization:
Note: If you select an organization from the main list before you click New Organization, the parent defaults to the selected organization.
- Choose No Parent to create a top-level organization that has no parent. Top level organizations are created with all available policies selected.
- Choose Select a Parent and click the Select button to view the entire organization hierarchy and select the parent for the organization you are creating.
- (OPTIONAL) If you select a parent, select the Copy all parent organization’s policies option to inherit all policies currently applied to the parent organization.
Note: This is a one-time action. Future changes to the parent’s policies do not affect descendants.
- Select at least one Owner for the organization from the drop-down list. The selected owner will have access to all operational and data view functions for the organization.
Note: Any changes to ownership and other user rights take effect at the next login of a user. This is also true for the administrator making the changes.
- (OPTIONAL) Enter a Description to help differentiate this organization from others in the hierarchy.
- Click Create to add the organization.
Add users/groups and assign roles
To add one or more users or groups:- Click Users & Orgs on the DbProtect taskbar.
- Click the Users tab.
- Click New User. The Create a User dialog opens.
- In the Grant Access To section, type a User or Group name and select a domain (if any).
- (OPTIONAL) Enter a Description.
- Click Add. The new user is added to the box below the Description field.
- Repeat steps 1 through 6 for any additional users or groups you want to add with identical roles.
- In the Add Roles section, click Add. The Organization Role Selector dialog opens.
- Select one or more Organizations that the roles will be associated with.
- Select one or more Roles to associate with the selected organizations.
- Click Add. The organization and associated roles are added to the list.
- Select a System Role from the drop-down list. Repeat as needed to add other system roles.
- Click Delete for any organization or system role to remove.
View a policy
Note: The legacy Policy Editor available in previous releases has been fully deprecated since the v6.6.1 release of DbProtect and is no longer part of the installation package. It has been replaced by the Policies page in the DbProtect Explorer. See Policies.
- On the navigation pane, click Policies. The Policies page opens.
- Click the Policy List tab.
- If the policy list is extensive, filter the list using one or all of the following, and click Apply:
- Search the list for policies using the policy name or part of the name.
- Filter the list by making selections from the Policy Type, Policy Template, and Status options.
- Select the policy you want to view to see summary information in the bottom pane, or double-click the policy to open the policy details pane.
- Choose an Asset type and expand the Checks categories to view individual checks performed in the policy.
Register a scan engine
Before registering, you must install the scan engine software. The required network port must be open between the DbProtect console server and the scan engine host. To register a new Scan Engine:- Click Settings on the DbProtect taskbar (far right side).
- Click the Scan Engines tab.
- Click Register New Scan Engine.
- Type an easily recognized Scan Engine Name.
- Enter the Hostname or IP address and the TCP Port.
- Click Register.
Jobs workflow
Add assets
There are multiple ways to add assets in the Jobs workflow, including adding manually, importing multiple assets from a CSV file, or running a discovery job to automatically detect and identify assets available on your network.Add an asset manually
To add a single asset manually:- Click Assets on the DbProtect taskbar.
- Click New. The Create an Asset dialog opens.
Note: For additional details about expected values for a field, click the help icon next to the field.
- Enter a unique, easily recognized Name for the asset.
- Click Select next to the Organization Associations field to choose an organization from the hierarchy.
- Select the Type of database server you are adding from the drop-down list.
- Enter the name of the Database/Instance/SID for this asset.
- Enter a Host (or IP address) and Port to be used for this asset and click Add Endpoint Below.
- Repeat this step to add additional endpoints.
- (OPTIONAL) Click Add as Preferred next to one of the endpoints. If no endpoint is set as preferred, the system will use the order of the endpoints as they appear in the list.
- (OPTIONAL) Select a Version from the drop-down list and identify the Platform for this version.
- (OPTIONAL) Click Add attributes, enter a Name and Value, and then click Set. Attributes can be used to refine searches. Click View system attribute names for a list of attribute names that have special meanings.
Note: If you have integrated DbProtect with CyberArk, you MUST add an attribute (
name="IDENTIFIER_KEY"andvalue="[nameOfCyberArkAsset]") to the new DbProtect asset. This asset identifier was set up in CyberArk prior to configuring DbProtect for integration (see DbProtect Install and Upgrade Guide, “Integrate CyberArk and DbProtect”). - Select the Create another asset checkbox if you want to create additional assets after this one is complete.
- Click Create. The asset is added to the list.
Note: If an identical asset already exists, the new asset is not added. Assets are uniquely identified by the Host Name, Instance Name, and Port.
Import assets
Import multiple assets by pasting a list in Comma Separated Value format (CSV). The CSV data must include a header row and a number of fields. Additional fields are optional. See Appendix E: Asset Import Example CSV Information for more information on CSV formats and examples. To import assets:- Click Assets on the DbProtect taskbar.
- Click Import. The Import Assets dialog opens.
- In the Assets pane, paste the CSV-formatted data. For more information about the data format, click View Sample File.
- (OPTIONAL) In the Asset Identity Descriptors field, enter the list of fields in the imported data that will be treated as part of the unique asset identifier. By default, the required fields host name, port, and instance name are used.
- In the Organization pane, select the Organization where new assets will be created. You can also include organization information in the CSV input.
- Click Test Import. If the test is not successful, make the required changes to the data.
- When the test is successful, click Import.
Add assets through discovery
Assets can be added to DbProtect by running a Discovery job.Set up and run a job
To create an audit, pen test, or rights review job:- Click Jobs in the DbProtect taskbar.
- Click New Job to open the Create a Job wizard and see a description of each type of job that you can create. If you know what type of job you want to create, click the down arrow next to New Job.
- On the first page of the wizard, select the Audit, Pen Test, or Rights Review template.
- Enter a Job Name.
- Click Select to open the Organization Selector.
- Select the organization to use for this job.
- (OPTIONAL) Click Add description and provide enough detail to differentiate this job from the others you will create.
- Click Continue.
- On the Assets side tab, click Add Assets to select the assets that will be tested in this job. See Add assets to jobs using saved and ad hoc queries for more information.
- (Audit and Rights Review jobs only) Click the Credentials side tab. The list of assets you have added is displayed showing the credential status for each asset. Each asset should display a green circle or green check mark for one type of credential, indicating adequate permissions. For any asset that shows Needs Attention or Failed:
- Click Add Override Credential. The Add Database Credentials dialog opens.
- Select an Authentication type from the drop-down list and provide the necessary information for the type you selected.
- Click Test to verify that the authentication type and related credentials are valid.
Note: You can continue to create a job without complete credentials but be aware that jobs without complete credentials may request attention at run time or some steps might fail. - Click the Policy side tab and select one or more policies to use. For more information about Policies, see View a policy.
- Click the Reports side tab.
- Click Add Report. The Report wizard opens.
- Select a report from This Job’s Results (recommended) or click Other to view a list of available report templates.
Note: Other reports give access to all available reports, whether or not they provide output related to the job.
- Click Next and complete the Input Settings for the type of report you have selected.
- Click Next and complete the Output Settings for the type of job you are creating.
- Click Save.
- Click the Advanced Settings side tab and complete the additional settings that are required to perform the job.
- Click Create to save the job.
- To run the job immediately, select the job on the Jobs page and click Run Now.
- To schedule a job for a future time, select it on the Jobs page and click Schedule, set the Schedule Type, Start Time, and Start Date, and click Save.
Note: The material and information contained in the User Creation Script is for general information purposes only. Users should not rely upon the material or information included in this script as a basis for correctly creating scan users to successfully perform audit scans against your company’s database environment. It is important to review these scripts with your internal Database Administration team and create a process for successfully creating the users needed to execute audit scans.
Set up basic monitoring
To utilize DbProtect’s Activity Monitoring capabilities to protect a database, you first need to install and configure a sensor.Register a sensor
Before registering a sensor, you must install the sensor software on the appropriate system. If a sensor is not already installed on your system, see the DbProtect Sensor Installation and Configuration Guide. To register an installed sensor:- Click Monitoring | Sensors. The Sensor Manager page opens.
- Click Register New Sensor. The Registration Manager page opens.
- Enter the IP Address/Host Name of the sensor machine.
- Enter the TCP Port where the sensor is listening (by default, port 20000).
- Click Next.
- On the summary screen, click Finish to accept the settings, or click Back to adjust settings.
Deploy a policy
After you have successfully installed, registered, and configured the sensor, you must deploy a policy to the sensor to tell it what specific events you wish it to monitor for. To deploy a policy:- Click Monitoring | Policies. The Policy Manager page opens.
- Click Deploy next to a named policy in the list that you want to deploy to the sensor you have prepared. The Policy Deployment page opens.
- Select an available database application from the list of configured sensors and the currently deployed policy for each (if any). You can filter the list in two ways:
- Type in the Search field to look for specific text in the descriptions of the sensor
- Select the Only show databases with stale policies to limit the list to sensors that require updated policies.
- Select one or more items and use the arrows to move the selected items into or out of the Deploy policy to list.
- Click Deploy to deploy the policy to the selected sensor(s). Deployment success or failure will be confirmed on this page.
Sensitive Data Discovery
The ability to scan database targets for Personally Identifiable Information (PII) and Personal Health Information (PHI) is available. This capability is included under the Vulnerability Management licensing in DbProtect. The databases supported at this time are:- Microsoft SQL Server
- Oracle
- MySQL
- PostgreSQL
Terms & Scoring
Current industry standard terminology and regulations in the United States are used as a basis for identification of the data. The scoring of the data is based on information discovered from the database schema and a sampling of the first ten (10) rows of data contained in the database tables. No information is ever removed from the database, as all analysis and pattern matching is done local to the target database. For more information on the scoring, see Appendix C: Sensitive Data Discovery (SDD). The following terms are considered both PII and PHI:- First Name, Middle Name, Last Name
- Address, PO Box, City, County, State, Country, Zip Code
- Gender, Birth Date
- Telephone Number, Fax Number, Email Address, IP Address
- Social Security Number, Social Insurance Number, Health Card Number
- Fingerprint, Voiceprint, Full Face Photo
- Driver’s License, Passport Number
- Age, Date of Death, Admission Date, Discharge Date
- Race, Ethnicity, Religion
- BMI, Web URL, Medical Record Number
- Health Insurance Provider, Health Insurance Group ID, Health Insurance Member ID
- Certificate/License Number, Vehicle Number, Device Identifier
Sensitive Data Discovery reporting
The results are all rated “Informational” and are classified as “Facts” in the results. To view the resultant data from the Sensitive Data Discovery checks, the “Check Results Details” report will need to be run.Working with Organizations, Users, and Roles
Organizations are flexible containers for database assets where you can:- Manage assets
- Enforce role-based access control for users
- Access, separate and/or filter data
- Manage the availability of policies for vulnerability management
- Impose operational restrictions for scan engines
- displaying a restricted list while setting up pen test or audit jobs
- filtering all reporting and dashboard data through a filter of only the elements enabled in the policy
Organizations
Edit an organization
To edit an organization:- Open the Users & Orgs page | Organizations tab.
- Select an organization and click Edit. The Edit Organization dialog opens.
- Modify the Name, add and delete Owners, and add or modify the Description of the organization.
- Click Save to apply the changes to the organization.
Copy an organization’s features
You can copy assets or descendants (child) structures from one organization to another. To copy assets to another organization:- On the Organizations tab, select the source organization that contains the assets you want to copy.
- Click Copy | Copy Assets to. The Copy Assets to dialog opens.
- Select the target organization and click Copy.
- Select the source organization that contains descendants (children) you want to copy.
- Click Copy | Copy Child Structure to. The Copy Child Structure to dialog opens.
- Select the target organization and then click Copy.
Delete an Organization
- To delete an organization, select it and then click Delete.
Apply policies to an organization
Policies are collections of checks that are used to run jobs. To apply policies to an organization:- Click Users & Orgs | Organizations tab.
- Select the organization and then click Manage Policies. The Manage Policies dialog opens.
- Select a policy (click and hold
Ctrlto multi-select) and use the arrows to add or remove them from the Selected Policies list. - Click Save to save changes.
Note: You should remove unused policies from child organizations.
Edit and delete users
To edit a user or group:- Click Users & Orgs | Users tab.
- Select the user or group you want to modify and click Edit. The Edit User dialog opens.
- Add or modify the Description as desired.
- In the list of Organization Roles, click Delete next to any organization-role combination that is no longer valid for the user.
- Click Add to add new organization-role combinations to the user.
- In the System Roles list, click Delete next to any system role that is no longer valid for the user.
- Select new System Roles for the user from the drop-down list.
- Click Save to update the user’s roles.
- Select the user or group.
- Click Delete.
Working with roles
Organization roles
These roles affect access only within the specific organization to which they are applied. A user that is associated with more than one organization can have different roles within each organization. Use of product functions for assets in each organization is limited by the user’s roles in that organization. DbProtect Organization RolesSystem roles
These roles apply to the setup, configuration, and maintenance of the system. They do not affect access to operations or reporting. System RolesWorking with policies in DbProtect Explorer
Create a new policy
DbProtect Vulnerability Management allows you to create an audit policy by defining the security checks it contains. This is known as a user-defined policy.Note: The legacy Policy Editor included in previous version of DbProtect has been fully deprecated and is no longer available. The new policy editor is in DbProtect Explorer and can be accessed only if the installation/upgrade of DbProtect included DbProtect Explorer.
- In DbProtect Explorer, click Management | Policies in the left navigation menu.
- Click New Policy at the top of the page. The New Policy dialog opens.
- Provide a Policy Name and Description (both are required fields).
- Click Create. The User-Defined Audit Policy pane opens.
- Select the correct Asset type from the drop-down list on the left.
- Explore the available Checks to determine which ones you would like to add to the new policy:
- Click the arrow beside each check category to expand it.
- Click a check name in the list to view a description of the check in the right-side pane.
- Select each individual check you want to include or select the top-level category name to select all checks within the category.
- Click Save Changes when you have selected all the checks you want to include in the policy.
- Click the X button at the top-left to close the page.
Rename or edit a policy
DbProtect Vulnerability Management allows you to edit a policy. You cannot permanently modify built-in policies. However, you can edit a built-in policy and use the “save as” function to save the edited policy under a different name. To rename or edit an existing policy:- Click Policies | Policy List.
- Modify the Search criteria in the left pane to filter the list, or move through the list using the navigation controls at the bottom right of the page.
- Select the policy you want to modify and click Edit. The User-Defined Audit Policy pane opens.
- Click the Edit (pencil) icon to modify the policy name (if required).
- Modify the Asset and Checks selection for the policy as needed.
- Click Save Changes (or Save As to create a new policy with the modified settings).
Search policies
DbProtect Vulnerability Management allows you to search policies for checks that match specified text search criteria. For instance, you can search for a specific CVE reference number. To search policies:- Select the organization the policy was assigned to from the OrgSelector drop-down list at the top right of the pane.
- Select the appropriate filter criteria for Policy Type, Policy Template, and Status for the policy you are searching for.
- Enter the policy name (or part of the name) into the search here field to look for a specific policy.
- To save a search, type a Search query name and click Save & Apply.
- To run an existing search, click Saved Searches and select the search you want to run.
Set up policy check report filters
DbProtect allows you to include report filters with specific checks in user-created pen test and audit policies. A report filter can be used to exclude specified parameter value(s) from being reported as a violation if found during a pen test or audit. You can add report filters only to user-defined policies.Note: Report filters are added via checks; therefore, a check must be enabled before you can access the Report Filters tab.
Report filter examples
Report filters are generally used when running access control checks, since many of these checks provide a list of all possible access points, including access points that are acceptable or required for an application to function. The following are some examples of report filters:- Oracle Check: Role granted WITH ADMIN option
Report filter: Role=DBA
This will result in DbProtect not reporting violations found for the DBA role for this check. - Oracle Check: Easily-guessed database password
Report filter: Username=John
This will result in DbProtect not reporting violations found for username: John for this check. - Oracle Check: Easily-guessed database password
Report filter: Username=John
Report filter: Password=12345
This will result in DbProtect not reporting violations found for username: John or any username with the password of ‘12345’.
Add report filters to a policy
To add a report filter:- In the Policy List tab, select the user-defined policy to which you want to add report filters and click Edit at the top of the list. The policy details slider opens.
Note: If you double-click on the policy to open it, you will not be in Edit mode and will not be able to select a check until you click Edit in the top-right corner of the slider.
- Select a check on which you want to filter (checkbox next to the check name must be selected). Once selected, the Report Filters tab is displayed next to the Knowledgebase tab.
- Click the Report Filters tab, then on New Filter. The New Report Filter slider opens.
- Select Global or Asset from the Scope drop-down list:
- Global: Report filters will be applied to all assets included in a report generated based on this user-defined policy, if no individual database assets are defined.
- Asset: If specific assets are defined, the report filter will be applied only to the database assets defined in the filter.
- Expand the Condition drop-down list and select one of the parameters available for the check you selected.
- Provide the Value for the parameter, then click the add icon to add the condition to the filter.
- Repeat steps 5-6 to add as many conditions as required.
- If you have selected to define specific assets, select an asset from the Asset Type drop-down list.
- Select Ipv4 and provide the IP address for the asset.
- Set the Port number and provide a descriptive Name for the asset.
- Click the add icon next to the Asset Type you select. The asset is added to the filter.
- Repeat steps 8-11 for each asset you want define for this filter.
- If an asset is incorrectly defined, you can modify the details, or click the remove icon to remove it from the filter.
- Click Save Changes in the top-right corner of the slider before closing the report filter.
View report filters
To view a report filter:- Click the enabled check containing the report filter you want to view.
- Click Report Filters. The Report Filters dialog opens, displaying a list of report filters.
- Click the + icon to expand the details of each report filter. Any report filter with a + contains risk acceptance information that can be viewed.
- Click OK to close the Report Filters dialog.
Edit report filters
To edit a report filter:- Click the enabled check containing the report filter you want to edit.
- Click Report Filters. The Report Filters dialog opens, displaying a list of report filters.
- Click on the report filter you want to edit.
- Click Edit. A dialog opens, displaying editing options for the report filter.
- Make your desired edits and click OK.
- Click OK. Your edits are automatically saved.
Delete report filters
To delete a report filter:- Click the enabled check containing the report filter you want to delete.
- Click Report Filters.
- Select the report filter you want to delete.
- Click Delete.
- Click Yes to verify the deletion. This will delete the report filter and any risk acceptance information you included for the selected report filter.
- Click OK to close the Report Filters dialog.
Import a policy
To import a policy:- In the Policy List tab, click Import. The Import Policies slider opens.
- In the Source drop-down list, select either Load file or Copy & Paste:
- If you select Load file, click the Load button to navigate to and select the file to import.
- If you select Copy & Paste, copy valid XML into the editing box. If the XML is invalid, it is indicated above the box. Edit the XML as needed to eliminate the Invalid XML warning.
Note: Click the copy icon to copy the contents of the XML editing box to another location or application. - Click Submit to begin the policy import.
Export a policy
DbProtect allows you to export user-defined policies. This is useful if you want to transfer policies between DbProtect Core and Explorer. Exported policies include any user-defined checks that are part of the policy.Note: You can only export user-defined policies. You cannot export built-in polices.
- In the Policy List tab, click Export. The Export Policies slider opens.
- Select the checkbox next to each policy you want to export, or select the top checkbox to select all policies in the list.
- Click the Data to Export arrow and choose between exporting all data, or just the exceptions.
- Click Submit to begin the export.
Activate/deactivate a policy
All policies can be activated or deactivated as required. Deactivated policies are not removed or deleted but are not run until reactivated. To activate/deactivate a policy:- On the Policy List tab, select the policy you want to activate/deactivate.
- Click the appropriate button at the top of the list to change the status of the policy.
- Click OK to save changes.
Working with scan engines
All activities involving scan engines are performed from the Scan Engines tab of the DbProtect Settings (far right of DbProtect taskbar). For users with adequate privileges to run jobs that scan databases, you need to define at least one scan engine. First, you need to download and install the scan engine on a host of your choice. Scan engines may be installed on the same host as the DbProtect application server, but also may be installed on other hosts. For proper functioning of scans, you may need to install database drivers on the same host as the scan engine(s). To establish a trust between your DbProtect system and its scan engines, you need to register each scan engine. See Register a scan engine for more information. For DbProtect environments where there is only one scan engine and no security concerns about users accessing scan engines, there is no need for further configuration. If your scan engine is shown to be Alive, it is ready for use. When you have installed a new SHATTER Knowledgebase, you will need to push this out to each scan engine. See Update the SHATTER Knowledgebase for more information.Advanced scan engine configuration
After registering a scan engine, you have the option to configure some advanced options that impact its use. Setting these configuration options are not required. You may return to set or change these options later. The definitions of these configuration options are described below.Additional per Scan Engine configuration
Target x509 Certificate Validation: ScanEngine v3.25 and later can be configured to validate x509 certificates provided by the scan target. This is a setting in the ScanEngine configuration file and applies to all hosts scanned using this ScanEngine. To enable this, add the following two values toappsettings.json in the ScanEngineHost installation folder (typically at %ProgramFiles%\LevelBlue\ScanEngineHost\appsettings.json)
appsettings.json
Unregister a Scan Engine
To unregister a scan engine:- Click Settings | Scan Engines.
- Select the scan engine from the list and click Unregister.
Note: Unregistering does not uninstall the scan engine software. In most cases, you should unregister first and then run the uninstallation from the Start menu on the scan engine host.
Configure a scan engine
To configure a scan engine:- Select a scan engine in the list and click Configure. The Configure Scan Engine dialog opens.
- On each of the side tabs of the dialog, you can perform the following tasks:
- Discovery Network Interface: Set the network interface to be used by the scan engine (if more than one is available on the server). This option directs the scanning to a specific subnet.
- Availability: Set the scan engine as Available or Unavailable (for instance, if the server is overloaded or you do not want to scan specific subnets).
- Organization Restrictions: Set the organizations that can use this scan engine.
- Group: Set an asset group so that the scan engine scans only the assets in the group. The restriction is evaluated at runtime along with any other restrictions made in the scanning job.
- Click Save.
Update the SHATTER Knowledgebase
The SHATTER Knowledgebase content is a collection of regularly updated framework of controls and checks that can be added to DbProtect to provide the most current protection to your databases, leveraging industry standards like CIS and DISA STIG and others. LevelBlue typically provides an updated version of the SHATTER Knowledgebase every four to six weeks. You can update the SHATTER Knowledgebase on the DbProtect console server by downloading the latest package from LevelBlue and installing it. To update the SHATTER Knowledgebase:- When a new Knowledgebase is available, click Settings | Scan Engines.
- Select the scan engine in the list and then click Update Knowledgebase. When the update is completed, Update Successful will be displayed above the scan engine list.
Note: When a new scan engine is registered, the latest SHATTER Knowledgebase is always used.
Working with assets
Edit or delete an asset
To edit the basic properties of an asset, such as the name, instance, endpoints, and attributes, select the asset and click Edit. To delete an asset, select the checkbox next to the item and click Delete.View asset details and credentials
To view details of an existing asset:- Select the asset from the assets list. The Details and Credentials tabs are displayed in the lower pane of the window. If these tabs are not visible, click Expand at the bottom right of the page.
- Click View Summary Report. The Summary Report opens in a separate browser window.
- Generate one of the drill-down reports (displayed as links below each report segment) for more detailed information.
- Click the Credentials tab. The details of the asset’s credentials (whether shared or individual) are displayed.
Add/modify/remove attributes for multiple assets
To add, modify, or remove attributes for one or more assets:- Select the checkboxes next to the assets with attributes you want to modify.
- Click Attributes. The Manage Attributes dialog opens.
- To add an attribute:
- Enter a new Attribute Name and Value for all the assets you have selected. System-reserved attribute names are shown on the Pre-Defined Attributes table.
- To modify an existing attribute:
- Existing attributes and values for the selected assets are listed. If an attribute has different values for different assets, click the arrow to the left of the attribute name to view all values.
- Select an attribute to populate the Name and Value fields, edit the fields as needed, and then click Set.
- To remove an attribute:
- Click Delete next to an existing attribute to delete it.
- When you have set all attributes, click Save to apply the changes.
Add/modify/remove organization associations
To add or remove organization associations for one or more assets:- Click Assets on the DbProtect taskbar.
- Select the checkboxes next to the assets you want to associate an organization with.
- Click Org Associations. The Organization Selector opens.
- Select the checkbox next to each organization you want to associate the asset(s) with.
- Click OK.
Manage credentials
DbProtect can use three types of credentials to run scans that require them. Since credentials can be defined at various levels of scope, jobs will evaluate and use credentials in the order of precedence as follows:- Job-based credentials: defined as part of a job (see Set up and run a job)
- Asset-based credentials: defined for a particular asset
- Shared credentials: defined for a group of assets matching a search expression
Notes
- If more than one credential is defined for an asset, the job will evaluate the credentials in the above order. Credentials can only be used in the same organization in which they are defined.
- If credentials for an asset are not correct at job runtime, you can update the credentials and continue the job (depending on job settings).
Add credentials to an individual asset
To add credentials to an individual asset:- Click New Credentials and then select the type, either Database or Windows. The Add Credentials dialog opens.
- Select an existing Credential Group or click New to create a new group:
- Type a name for the group.
- Select the organization to add to the new group.
- Select the Authentication Type.
- Enter the credential information appropriate for the type, and then click Test.
- If the test is successful, click Save to save the credentials for this asset.
Delete asset-based credentials
- To delete the credentials for an asset, select the checkbox next to the item and click Delete.
Note: Asset group and shared credentials cannot be deleted from this pane.
Import and export credentials
To import credentials in CSV format:- In the upper right of the Assets page, click Manage Credentials | Import Organization Credentials.
- Paste the data from a CSV file into the Credentials field. For a sample of the data format, click View sample file.
- Select an Organization from the hierarchy.
-
Click Test Import.
- If the test is not successful, edit the CSV data.
- If the test is successful, click Import.
- In the upper right of the Assets page, click Manage Credentials | Export Organization Credentials.
- Select an Organization from the hierarchy and click Export Credentials in CSV Format Below.
- Copy the resulting CSV data from the Credentials field.
Note: Passwords are included in encrypted format.
Create/modify/delete per-asset credential groups
Management of per-asset credentials is performed by selecting the asset and then using the Credentials tab in the lower pane. To create/modify/delete per-asset credential groups:- In the upper right of the Assets page, click Manage Credentials | Manage Per Asset Credential Groups.
- Click New Group to add a group to an organization, type a Credential Group Name, select the organization it should be added to, and click Create.
- Select the checkbox next to an existing credential group name, click Edit to modify the name of the group, and click Update. The modified group name is displayed.
Note: You cannot change the organization associated with an existing credential group. To do this, you must delete the existing credential and create a new one with the correct organization selected.
- Select the checkbox next to any credential group you want to remove and click Delete.
Create/modify/delete shared credential groups
DbProtect allows you to create shared credential groups that contain credentials common to a set of assets. Whenever a job requires credentials for an asset and no per-job or per-asset credential is successfully applied, the job will attempt to use shared credentials. To create/modify/delete shared credential groups:- Click Manage Credentials | Manage Shared Groups.
- To add a new credential group, click New Group. The Create a Shared Credential Group dialog opens:
- Type a Credential Group Name.
- Click in the Organization field, select an organization from the hierarchy, and click OK.
- Define the group using an asset search query (see Search assets).
- Click Create to create the group.
- Edit a credential group’s membership:
- Select a group and click Edit.
- Modify the name and/or the asset query, and then click Save. You cannot change the organization associated with the group.
- Add credentials to a group:
- Select a group, click Add Credentials and select the credential type from the list. The Add Credentials dialog opens.
- Select the Authentication Type from the drop-down list and provide the information required to complete the authentication.
- Click Save.
Note: For additional details about expected values for some fields, click the help icon next to the field.
- To delete a credential group select it in the list and then click Delete.
- To close the shared groups window, click OK.
Note: The shared credential dialog does not provide a test option. Before running jobs that use shared credentials you should test the credentials for some or all of the assets by selecting the asset from asset search results and using the credential tab on the lower pane.
Search assets
You can limit the list of assets presented on the Assets page by performing a search. Search queries can be defined using either or both of the following options:- Apply one or more “facets”. Facets are specific attributes of assets that have a limited number of possible values, such as database type and network location.
- Apply a search expression, optionally using Boolean, likeness, string, and arithmetic operators.
Note: If you define both an expression and facets, only items matching both will display in the results.
Filter with facets
You can limit the search by one or more of the following facets:- Databases: Database technologies and versions, such as Microsoft SQL Server 2012 Express
- Networks: IPv4 class A or class B networks such as
10.*.*.*or10.2.*.* - Platforms: Operating system versions such as SCO Unix or Microsoft Windows x86
- Organizations: Groupings of assets that you have created
Set up a search query
To set up a search query:- Select the checkbox next to each facet item you want to include in the search:
- Click the arrows to expand each facet type
- Click more to view a full list of items for each facet type
- Click all next to a facet type to select all items
- Click clear to remove all selections for a facet type
- Click Update Search Results to apply the facet and search expression selections to the list on the Asset Search Results page.
- Click Reset at the bottom of the pane to reset all facet and search expression selections.
- Click Save Search Query As at the bottom of the pane to save the facet and search expression selections for later use.
Use search expressions
Use a plain text search to look for the text in any text field of an asset. For example, if you enterexpress in the Search field and click Update Search Results, the results include assets with a name or a database instance name that contains the string express.
Expressions must be enclosed in parentheses ( ) and can include operators and asset attributes.
Notes:
- An expression using a like operator that does not include explicit % characters (any substring) assumes that they are present at the beginning and at the end of the pattern. For example,
~ 'test'is treated as~'%test%'. - The operators exists and not exists can be used only with attribute names.
- Single or double quotes can be used when writing strings (the opening and closing quote must be the same). For example,
'test'is the same as"test".
Pre-Defined Attributes
To use a search expression with facets:
- Type the search expression in the Search field.
- Select the facets you want to include in your search.
- Click Update Search Results.
- Click Reset at the bottom of the pane to reset all facet and search expression selections.
- Click Save Search Query As at the bottom of the pane to save the facet and search expression selections for later use.
Use saved search queries
Search queries can be saved to quickly return to a custom view of the asset search results. You can also use saved queries when you create jobs. To save a search query:- Set up the query (facet and search expression selections) as desired.
- Click Save Search Query As at the bottom of the pane.
- Type a Name and select an Organization to associate the query with.
- Click Save.
- Click Saved Search Queries at the top of the Search pane and select an item from the list. The Asset Search Results pane will be updated to match the query.
- Modify the query as desired and click Save above the search expression field.
- Click Close above the search expression field to return to an unfiltered view in the Asset Search Results pane.
Asset groups
There are cases when it makes sense to encapsulate several assets into one asset group and to operate on this group as one unit. Some examples of when this can be useful are:- Oracle 12c in multi-tenancy mode: You can create individual assets corresponding to individual Pluggable Databases (PDBs), and the Container Database (CDB), and then mark them as a part of one group representing the entire database instance.
- Oracle RAC: You can create individual assets corresponding to various databases that participate in the high-availability configurations of one RAC and mark them as a part of one group.
- Windows Server Failover Clusters: You can create individual assets corresponding to individual instances that work together to provide the AlwaysOn and High-availability features and then mark them as a part of one group.
View the assigned asset group for an asset
If you are uncertain which asset group (if any) an asset has been assigned to:- Click Assets on the DbProtect taskbar.
- In the Asset Search Results pane, mouse-over any column header and click the down arrow that appears on the right side.
- Choose Columns | Asset Group. The Asset Group column will be visible, and if the assets have been assigned to an asset group, the group name will be displayed in the column.
Set up asset group credentials
If the assets in a group share the same credentials, you can set up a shared credential group using the asset group. To set up shared credentials using an asset group:- Add attributes to multiple assets (previously known as Bulk Attribute Management), using “assetGroup” as the Attribute Name and the name you want for the asset group as the Value.
- Add a shared credential group and use the string
assetGroup="[assetGroup Name]"for the asset search query.
Use an asset group in a job
It can be useful to run a job against an asset group rather than running separate jobs against individual assets. To run a job against an asset group:- Add attributes to multiple assets, using “assetGroup” as the Attribute Name and the name you want for the asset group as the Value.
- Click Jobs page | Jobs tab.
- Click New Job and select the type of job you want to create.
- Enter a Job Name and select the Organization the job will be run in.
- Click Continue. The Edit Job dialog opens to the Assets side tab.
- Click the Ad Hoc Query option at the top of the Assets list.
-
Type or paste the following string into the Asset Query Search field:
assetGroup="[assetGroup Name]"where[assetGroup Name]is the name you gave to the asset group when setting up the attributes. - Click Search. The assets you provided asset group attributes for are listed in the Asset Preview pane.
- Click Create. Continue with the job set up.
Working with Jobs
DbProtect offers support for various types of security testing jobsSet up a credential test job
A credential test job performs a test of the credentials you have added to the assets of any other job type. To create a credential test job:- Click New Job | Credential Test on the Jobs tab. The Create a Job dialog opens.
- Type a Job Name and select the Organization that contains the job you want the credentials test to be run against.
- Click Continue. The Edit Job dialog opens.
- Select the Job containing the assets with credentials you want to test.
- Click Next on the Advanced Settings side tab.
- Provide email addresses to be notified at job completion.
- Select the Treat missing permissions as fatal option to indicate whether the job should report a failure if some credentials are valid for connection but missing required permissions for the job tasks.
- Click Save. The job is set up and now appears in the Jobs list.
- Click Run Now to run the job immediately.
- Click Schedule and select the Schedule Type, Start Time, and Start Date, to run the job in the future (one-time or recurring).
Set up a discovery job
To create a discovery job:- Click New Job | Discovery on the Jobs tab. The Create a Job dialog opens.
- Type a Job Name and select the Organization that contains the assets you want to discover.
- Click Continue. The Edit Job dialog opens.
- On the Discovery Criteria side tab, click Add Criteria. The Add Discovery Criteria dialog opens.
- Enter Network Destinations. For examples, see the text and link below the field.
- Select Port Options.
- Select Add defaults to check the default ports for database types.
- Select Add specific ports if you know that your organization’s databases listen on nonstandard ports.
- Select the Bypass port scanning option if scanning is not possible in the environment.
- Select the checkbox next to at least one Asset Type, or the checkbox next to Asset Types to select all items.
- Click Add. Repeat previous steps to add additional criteria to the job.
- Select an existing criteria and click Edit to change criteria details.
- Select an existing criteria and click Delete to remove it from the job.
- Click Next or click the Reports side tab to set up one or more reports to run as part of this job.
- Click Add Report.
Note: For Discovery jobs, only the Other report scope is available.
- Select a Report Template (Asset Inventory is commonly selected for discovery jobs), or select the Filter Shortcut option and paste a shortcut string into the field.
- Click Change scope organization for this report to run the report on a descendant (child) organization to reduce the scope of data reported on.
- Click Next and select an Organization for the report to be run on.
- Click Next and set the Input Settings.
- Click Next and set the Output Settings.
- Click Save.
- Click Add Report.
- Click Next or click the Advanced Settings side tab and:
- Provide email addresses to be notified at job completion, or if credential problems occur.
- Add one or more Known database/instance/SID names.
Note: This option can help to find databases if security restrictions are in place, such as SQL Browser being stopped.
- Add one or more Oracle listener passwords.
- Select the Scan unresponsive hosts option (hosts that do not respond on closed ports) if you want to ensure full results. This will likely increase the time to complete a Discovery job.
- Select the Save additional information option to save any data gathered as asset attributes
- Select the Update asset version and platform… option if you want an existing asset to be updated if newer versions are available.
- Select the Ignore duplicates and errors option to reduce the time to complete the scan
- Select the Replace existing endpoints with discovered ones option to update existing endpoints that have changed since being added to your assets.
- Click Save. The job is set up and now appears in the Jobs list.
- Click Run Now to run the job immediately.
- Click Schedule and select the Schedule Type, Start Time, and Start Date, to run the job in the future (one-time or recurring).
Set up a report job
Apart from the built-in on demand reports available on the Reports page, you can also set up regularly scheduled report jobs. To set up a report job:- Click Jobs page | Jobs | New Job. The Create a Job dialog opens.
- Select the Report job template in the left pane, type a Job Name, and select an Organization for the job to run on.
- Click Continue. The Edit Job dialog opens.
- Click Add Report. The Report Wizard opens.
- Select a Report Template or select the Filter Shortcut option to create a custom report and paste a shortcut string into the field.
- Click Change scope organization for this report to run the report on a descendant (child) organization and reduce the scope of data reported on.
-
Click Next and set the Input Settings. Depending on the report template you chose, there may be additional options to complete. For example, in some reports you will need to:
- Select an organization for the report. You can choose the organization specified in the job, or an available descendant (child). Click the Include descendants option if you want all child organizations to be included.
- Select an asset to report on and a specific user to report on.
- Choose to include non-scannable assets. Non-scannable assets may include Oracle Listeners and SQL Redirects.
- Specify the results filtering and scope of the report.
Note: When reports are generated at the scope of an organization, all check results for all assets in the organization are considered. These results are first filtered by checks that are available to policies associated with the organization. If different policies include different report filters on the same check, all report filters on each check will be applied.It can be useful to limit the report to specific assets, or to report on check results based on a specific policy or even a specific audit job. When reports are filtered through a specific policy (“Policy Lens”), only the checks from that policy are included and the report filters specified in that policy are applied. -
Select a type of filtering, and then select the detailed values. For example:
- In the Check Results Summary, you can choose to filter by assets, attributes, or a specific job, or an organization.
- You can also choose to filter through a specific Audit or Pen Test policy (“Policy Lens”).
- You can choose to include SHATTER Knowledgebase articles in the report.
-
Click Next and set the Output Settings for the report.
- Enter a Report Name and select an output Format.
- (OPTIONAL) Enter the email addresses of users who should receive a link to the completed report.
- Click Save to add the report to the list.
- Click Next or click the Advanced Settings side tab.
- Add the email addresses of users who should receive a notification when the job is complete.
- Click Save. The job is set up and now appears in the Jobs list.
- Click Run Now to run the job immediately.
- Click Schedule and select the Schedule Type, Start Time, and Start Date, to run the job in the future (one-time or recurring).
Add assets to jobs using saved and ad hoc queries
To add assets to jobs using saved and ad hoc queries:- Create the job (see Set up and run a job), and when you are ready to add assets select one of the two following selections:
- Saved query:
- Click the Saved Query option.
- Choose a saved query from the list on the left side of the Assets side tab. Assets matching the query display in the right pane. You cannot modify the query within the wizard.
- To modify saved queries, see Use saved search queries.
- Ad Hoc Query:
- Click the Ad Hoc Query option.
- Select facets and/or enter a search expression in the left pane.
- Click Search. Assets matching the query display in the right pane.
- Saved query:
- Click Next to continue, or click the Policy side tab.
- Continue with the job setup as per Set up and run a job.
Edit a Job
- To edit a job, select it and then click Edit in the toolbar. For help with the available settings see the sections on creating a job, above.
Clone a Job
- To make a copy of a job, select it and then click Clone in the toolbar. Cloning does not copy the job schedule. After cloning a job, edit it as required and schedule it if required.
Delete a Job
- To delete a job, select it and then click Delete in the toolbar.
Monitor job progress
Once a job has been set up and scheduled, you can view its progress through the remaining tabs on the Jobs page:Advanced Monitoring
Note: DbProtect Explorer now offers direct access to Alerts. See Working with DbProtect Explorer Alerts for information about using this new feature.
Alerts tab
On this tab of the Monitoring section, you can review alerts generated by monitoring sensors.- Click any column heading to sort the list.
- Click the Alert ID number to view details of an alert.
- Select the checkboxes of one or more alerts to perform the actions on the buttons at the bottom of the list.
Refresh alerts
There are a number of options for refreshing alerts:- Click the Refresh button to manually refresh the alert list.
- To refresh automatically, set a time in seconds and click Start. To stop refreshing, click Stop.
- To change the auto-refresh interval while it is running, enter a time in seconds and then click Update.
Filter alerts
There are several options for filtering the list of alerts displayed so you can focus on the criteria that are the most urgent or important.- To filter the alerts shown in the list, make selections from the menus and/or enter parameters in the fields and click Apply Criteria.
- Type a number in the Count field to view only a set number of alerts at a time.
- Type in the Search in SQL Text field to search for the specific SQL query that executed and triggered the alert.
Viewing alert details
- Click the Alert ID number for an alert to view its information. The details will be displayed in a separate browser window and provide a full listing of all available information about the alert.
- Click Archive or Acknowledge to process this alert from the detail window or close the window to return to the full list of alerts.
Acknowledge and archive alerts
Acknowledging an alert indicates that you have reviewed it.- Click the Hide Acknowledged option if you want acknowledged alerts to be automatically hidden from the active list of alerts.
- Archiving an alert moves the alert to the Archive tab and acknowledges the alert if it has not yet been acknowledged.
- Filter the alerts as desired.
- Click Archive All Alerts or Acknowledge All Alerts to archive or acknowledge all alerts shown. All displayed alerts will be removed from the list, and if you chose to archive the alerts, they will be moved to the Archive tab. OR Select the checkboxes next to one or more alerts that you want to acknowledge or archive and click Archive Selected Alerts or Acknowledge Selected Alerts. The selected alerts will be removed from the list and if you choose to archive the alerts, they will be moved to the Archive tab.
Note: You can also perform these actions for a specific alert from the detail window.
View archived alerts
- Click the Archive tab on the Alerts page to view the list of alerts that have been archived.
Un-archiving alerts
- Click the Alert ID next to an archived alert. The Details window opens.
- Click Un-archive to restore the selected alert(s) from the archive to the active list.
Delete alerts
Notes:
- You can only delete alerts from the Archive list and not from the active alerts list.
- Deletion is permanent.
- Filter the alerts as desired.
- Click Delete All Archived Alerts. All alerts displayed will be permanently deleted from DbProtect. OR Select the checkboxes next to one or more alerts and click Delete Selected Archived Alerts. The selected alerts will be deleted from DbProtect.
Monitoring Dashboard tab
The Monitoring Dashboard shows sensor health and alert status at a glance. Sensors’ Health This section shows the number of registered sensors. If any sensors are not responding to the console a list of details displays. For the most accurate information about unresponsive sensors, see the Alerts tab. Unacknowledged Security Alerts This section includes two graphs. One shows the total number of unacknowledged alerts, and the other shows the number of unacknowledged alerts received today. Informational Alerts This section shows the number of informational alerts received today.Monitoring Reports tab
In this version of DbProtect, all reports are managed from the Report section of the main user interface. To generate on-demand reports of monitoring activity, see Report | On Demand | Monitored Events.Monitoring Policies tab
This tab allows you to manage and deploy monitoring policies for sensors. A monitoring policy is a collection of rules or activity monitoring checks. LevelBlue provides several default monitoring policies, and you can also import or create your own policies to meet your organization’s security requirements.Note: These policies are used for monitoring sensors and are managed separately from the vulnerability policies applied during the job setup.
Create a policy
To create a policy:- Click Create New Policy. The DbProtect Activity Monitoring Policies page opens in a new browser window and displays a hierarchy view of available policy rules.
- Expand the tree to see available rules for each server type and category.
- Click the rule name to view details of the threats or behaviors covered in the right pane.
Note: Exceptions that you have created are displayed in the hierarchy as branches below (within) the rule that you created an exception to. See Create exceptions for information about creating exceptions.
- Select the checkboxes next to each rule that you want to include in your policy.
- Set the Risk Level for each rule using the menu for that rule (displayed at the end of the rule name).
- When you have completed your selections, enter a name for the policy at the top of the rules list and click Save. The new policy is displayed in the list on the Monitoring | Policies tab and is available for deployment.
Edit a policy
To modify a policy:- Click the Edit button next to a named policy in the list. The DbProtect Activity Monitoring Policies page opens in a new browser window.
- Expand the tree to see available rules for each server type and category.
- Click the rule name to view details of the threats or behaviors covered in the right pane.
- Select the checkbox next to each rule that you want to include in your policy.
- Set the Risk Level for each rule using the menu for that rule (displayed at the end of the rule name).
- When you have completed your selections:
- If you edited a custom policy that you had previously created, click Save to save changes, or enter a new name and click Save As to save a new policy and keep the existing policy.
- If you edited a built-in policy, you can only Save As (you cannot change built-in policies). The new policy is displayed in the list on the Monitoring | Policies tab and is available for deployment.
Note: After editing a policy that is deployed, you must re-deploy the policy to apply any changes to sensors.
Delete a policy
- Click Delete next to a policy that you created to delete it. Built-in policies cannot be deleted.
Export and import a policy
To export a policy:- Click the Export button for the policy in the list.
- Navigate to the location where you want the resulting XML file to be located and click Save.
- Click Import Policy.
- Click Choose File and navigate to the location where you have previously saved a valid policy XML file.
- Select the file and click Open. The file name is displayed next to the Choose File button.
- If you want to overwrite an existing policy with the same name as the one you’ve selected, select the Import with overwrite option.
Note: The file name is not the policy name. The policy name is found within the file.
- Click Import.
Re-deploy multiple policies
This feature can re-deploy multiple different policies that were already deployed to various sensors. For example, you may want to re-deploy multiple updated policies to sensors where the policies are out of date. This differs from deploying a single policy to multiple sensors, which is what occurs when you deploy from the Policy Manager page. To re-deploy the currently configured policies on more than one sensor:- Click Deploy Policies in Bulk. The Policy Deployment page opens and displays a list of sensors and the policies that have been deployed to them.
- On the Policy Deployment page, the list of available database applications shows configured Sensors and the currently deployed policy for each (if any).
- Type in the Search field to look for specific text in the descriptions of the sensor
- Select the Only show databases with stale policies to limit the list to sensors that require updated policies.
- Select one or more items and use the arrows to move the selected items into or out of the Re-deploy policies to list.
- Click Deploy to re-deploy selected policies to the sensor(s). Deployment success or failure will be confirmed on this page.
Filters
This tab allows you to create and manage filters that can be included in monitoring policies. Filters allow you to create exceptions to rules and alerts and allow you to create rules specific to your environment (for instance, to monitor a specific function or procedure).Create audit filters
- Under Audit Filter Wizard, click Create. The Filter Manager page opens.
- Select the database type and click Next. The Audit Filter Wizard opens.
- Select one or more types of actions to audit, and then click Next. Available actions include:
- SELECT, INSERT, UPDATE, and DELETE actions on user and system tables and views
- EXECUTION of Stored Procedures and Functions
- Select the Database Instance to audit from the drop-down list and click Next.
- Select the Database to audit from the drop-down list and click Next.
- Select the object(s) to audit. To select multiple items, press
Ctrlwhile selecting the items, or click and drag your mouse down the entire list to select all items.- For any tables selected in the list, select Yes or No to indicate whether to audit on the column level.
- Select one or more stored procedures and functions that you would like to audit.
- Click Next. The following page of the Audit Filter Wizard may take a few moments to load, depending on the number of items selected on the previous page.
- If you choose to audit on the column level, select the columns to audit (for each table you selected) and click Next.
- Type a Title and other descriptive information for the audit.
- Select a Risk Level from the drop-down list and click Next.
Note: Items with Info-[#] selected for Risk Level do not display in detail in the console.
- Review the details of your audit filter. Click Back to make changes or Save to create the filter.
- Click Add filter to policy to go to the Policy Manager page.
- Click Edit next to the policy you want to add the newly created filter to. The DbProtect Activity Monitoring Policies page opens in a new window.
- Expand the tree for the database type you selected when creating the filter, then expand Audit Events.
- Scroll down the list and expand the User [action or function] item that matches the selection you made when creating the filter (e.g., “User Table – Select” or “User defined function”)
- Select the checkbox next to the filter you created and:
- If you edited a custom policy that you had previously created, click Save to save changes, or enter a new name and click Save As to save a new policy and keep the existing policy.
- If you edited a built-in policy, you can only Save As (you cannot change built-in policies).
Create exceptions
To create an exception:- Under Exception Wizard, click Create. The Filter Manager opens.
- Select the database type and click Next. The Exception Wizard opens.
- From the Create an exception for the rule drop-down list, select a rule. If you want to create a Global Exception (not limited to specific rules), select All [database type] Activity.
- Click Next.
-
Add one or more conditions that define the situations where the parent rule should not fire.
Notes: If you add more than one condition, the exception will only apply when ALL conditions are true.
- To make exceptions for several different single conditions, the preferred method for readability is to create an exception for each condition.
- You can also edit the expression using the Advanced Filter and Exception Editor and change the
<and>condition to<or>.
- Type a Title and other descriptive information for the audit and click Next.
- Review the details of your exception filter. Click Back to make changes or Save to create the filter.
- Click Add to policy to open the Policy Manager page.
-
Expand the tree for the database type you selected when creating the filter, then expand the tree further to find the parent rule that you created the exception for.
Note: Some rules, such as “All Microsoft SQL Server 2005/2008/2012/2014 Activity” will result in your exception being placed in the User-defined Global Exceptions folder.
-
Select the checkbox next to the filter you created and:
- If you edited a custom policy that you had previously created, click Save to save changes, or enter a new name and click Save As to save a new policy and keep the existing policy.
- If you edited a built-in policy, you can only Save As (you cannot change built-in policies).
Create advanced filters and exceptions
- Under Advanced Filter and Exception Wizard, click Create. The Filter Manager opens.
- Choose the database type and click Next. The Advanced Filter Editor opens.
- Select the rule that you want to create the filter or exception for. If you want to create a global exception or filter (not limited to specific activity types), select All [database type] Activity.
- Click Next.
- Select whether to trigger ONLY when the conditions are met or EXCEPT when the conditions are met.
-
Enter expressions and conditions that define the filter.
The filter is saved in an XML document and must be valid XML
- Each expression consists of a name, an operator, and a value. The Legend shows available operators and some common names.
- For a full list of names, see Appendix A: Monitoring Filter Name Attributes.
- Expressions can be combined using the operators AND and OR.
Note: The expression editor performs some basic checking of the XML format and the contents of the expressions. The editor does not check for valid tag names.A good way to understand the format of filters is to create some filters or exceptions using the wizards, and then edit them in the Advanced Filter and Exception Editor to see how the information is saved - Click Next.
- Type a Title and other descriptive information for the audit.
-
Select a Risk Level from the drop-down list and click Next.
Note: Items with Info-[#] selected for Risk Level do not display in detail in the console.
- Review the details of your filter. Click Back to make changes or Save to create the filter.
- Click Add to policy to open the Policy Manager page.
-
Expand the tree for the database type you selected when creating the filter, then expand the tree further to find the parent rule that you created the filter for.
Note: Some rules, such as “All Microsoft SQL Server 2005/2008/2012/2014 Activity” will result in your exception being placed in the User-defined Global Filters folder.
-
Select the checkbox next to the filter you created and:
- If you edited a custom policy that you had previously created, click Save to save changes, or enter a new name and click Save As to save a new policy and keep the existing policy.
- If you edited a built-in policy, you can only Save As (you cannot change built-in policies).
Edit a filter
- Click Edit next to the filter you want to modify. The item will be opened for editing in the Advanced Editor Wizard. Make changes as required and click Save.
Note: If the filter is active in any policies, you must re-deploy the policies to apply your change on the sensors. Policies that require deployment are marked as “stale” on the Policy Manager tab.
Delete a filter
Note: You cannot delete a filter that is actively used in a policy. If you attempt to delete an active filter, you will be informed of the policy or policies where it is used.
- Click Delete next to the filter or exception you want to remove. You will be asked for confirmation.
Import a filter
To import a file containing filters:- Under Import Filters, click Import.
- Click Choose File and navigate to the location where you have previously saved a valid policy XML file.
- If you want to overwrite existing filters with the same names as filters found in the file, select the Import with overwrite option.
Note: The file name is not the filter name. The filter name(s) is found within the file.
- Click Import.
Export a filter
- Select one or more checkboxes beside the filter you want to export from the My Filters list. To select all items, select the checkbox under the Export button.
- Click Export.
- Navigate to the location where you want to save the resulting XML file and click Save.
Sensors tab
This tab allows you to register and configure sensors. For full information about installing and configuring sensors see the DbProtect Sensor Installation and Configuration Guide. The main page of the Sensors tab lists all registered sensors in the left pane and shows the status of each sensor.View sensor details
- Select a sensor name in the left pane to view details in the right pane. Sensors that cannot be contacted or that have a configuration issue display a warning icon.
- If many sensors are configured, type text in the Filter field and click Apply.
- Click Refresh Status to make sure you are looking at an accurate list of available sensors.
View sensor configuration details
- Click View Sensor Configuration Details to view a summary of configuration for all sensors. The Configuration Summary page lists the availability, network location, version, database instance monitored, and policy deployed for each sensor alias.
- Click Download CSV to download the information to file you can save.
- Click Back to return to the main page.
Configure or reconfigure a sensor
To configure or reconfigure database instances on an installed sensor:- Select the sensor in the left pane to view details in the right pane.
Note: You cannot reconfigure a sensor that cannot be contacted.
- Click Reconfigure to display the details of the configured instances on the sensor.
- Click Reconfigure next to a defined instance. For detailed procedures, see the DbProtect Sensor Installation and Configuration Guide.
- Click X next to a defined instance to remove it from the list of configured sensors.
- Click Configure New Instance to configure a new instance of the sensor. For detailed procedures, see the DbProtect Sensor Installation and Configuration Guide.
- Under Advanced Settings, click Modify to change the logging level for the sensor.
- Select a different logging level from the drop-down list and click OK.
- When you have completed all required changes, click Deploy to Sensor.
Note: If you do not deploy the changes, they will be lost.
Unregister a sensor
Unregistering stops sensor activity for all database instances configured on that sensor and removes the connection between the console and the sensor. To unregister a sensor:- Select the sensor in the left pane to view details in the right pane.
- Click Unregister. You will be asked for confirmation.
Note: Unregistering does not uninstall the sensor software. After unregistering you should proceed to uninstall the software from the server where it is installed.
Deploy multiple policies
To re-deploy multiple policies to sensors, click Deploy Policies in Bulk, then refer to Re-deploy multiple policies for further instructions to complete this task.Monitoring Settings
There are three sub-tabs for the Monitoring Settings feature, allowing you to set the following for automated monitoring communications within DbProtect:- Email forwarding rules
- Forwarding settings
- Email server settings
Email Forwarding Rules
Define alerts that you want DbProtect to report to users by email. Available actions are listed on the page.Note: If no rules are defined, the first page of the rule creation wizard displays as the default item of the tab.
Create or modify an email forwarding rule
- Click Create a new Email Forwarding Rule (below the existing rules list, if any). OR Click Modify next to an existing rule that you want to change.
- On the first page of the Email Forwarding Rules Wizard, type or modify Template Name for the rule and type (or paste) a list of email addresses to send activity notifications to. Addresses should be comma-separated; the entire list cannot exceed 256 characters.
- Click Next.
-
On the criteria page of the wizard, select:
- One or more server aliases (
Ctrl-click to select more than one; click ALL to select all) - One or more alert titles (
Ctrl-click to select more than one; click ALL to select all) - A time range (any time, or a start and end time in 24-hour format)
- One or more risk levels
- One or more server aliases (
- Click Next.
- On the fields page of the wizard, select one or more fields to include in the message, and use the arrow buttons to move them between the Possible Fields and Fields to Send boxes.
- Click Next.
- On the summary page of the wizard, review the rule.
- Click Back to make changes or Save to save the rule. New rules are active by default.
Forwarding settings
Specify settings for email alerting checks:- Polling Frequency: Enter the number of minutes between checks by DbProtect for new alerts that match the forwarding rules. The default polling frequency is 5 minutes.
- Maximum Alerts to Handle: Enter the maximum number of alerts you want DbProtect Activity Monitoring to send in each email.
Email server settings
Email server settings are now managed in Settings | Email.Working with DbProtect Explorer Alerts
The Alerts tab functionality that is available in DbProtect Core is being replaced and expanded in DbProtect Explorer. The new Alerts tab provides the same easy access to active and archived alerts and displays alerts that have already been acknowledged. Beginning with DbProtect Explorer v6.6.1, there is also an early preview of the new Anomalies tab, where you can view anomaly alerts generated by machine learning (ML) developed from the standard DbProtect sensor data. The Anomaly Detector analyzes existing sensor data to learn database access, login, and use patterns, and then generates anomaly alerts based on deviations from those patterns. Alerts generated by the DbProtect sensors are displayed on the All Alerts tab on the Alerts page. To filter the alerts list:- Select a timeframe from the drop-down list at the top of the filter pane.
- Indicate whether you want to show Archived or Acknowledged alerts in the list.
- Select the level(s) of Risk you would like to filter the list with.
- Click Update Search. The list is updated.
- Select an alert to view its initial details in the bottom pane or double-click to view full information.
Archive or Acknowledge alerts
To archive or acknowledge alerts:- Select the checkbox next to each alert you want to archive or acknowledge, or select the checkbox at the top of the column to select all items.
- Click the Archive or Acknowledge button, as required.
Filter Anomalies (Preview)
Anomalies are specialized machine learning-based alerts that represent variations from typical user and/or system activity. They are represented in the Anomalies pane with one of two icons:- Anomaly
- First-seen anomaly (reverts to the Anomaly icon if the same alert is raised more than once)
- Select a timeframe from the drop-down list at the top of the filter pane.
- (OPTIONAL) Click the add condition icon to apply further conditions to the list using either “contains” or “does not contain” criteria.
- Click Update Search. The list is updated.
- Select an alert to view initial details in the bottom pane, or double-click for full information.
Working with Reports
DbProtect provides a large number of reports. New reports might be added when you update the Analytics Content. You should always update to the latest available version of Analytics Content to ensure that you have the most up-to-date reporting functionality.Note: To generate a list of all available reports, including descriptions of purpose and output formats, see Filtering and Generating Reports.
Filter a report
For information on how to filter reports in the Explorer UI, refer to Filtering and Generating Reports.Difference between On Demand reports and Job reports
On Demand Reports and Job Reports on the same assets might show different results.- On Demand reports are generated from the Explorer Dashboard and can be filtered based on various criteria. DbProtect calculates an effective policy based on all policies available to the organization. The report output shows the results based on date and other criteria specified.
- When a report is generated as part of a specific audit job, the report output shows only the results from that run of the job. These results will usually have a much more focused, effective policy.
Modify System Settings
The System Settings section of DbProtect Core allows you to review DbProtect system performance, manage licensing and email sending settings, and manage Scan Engine registrations.About DbProtect
This page displays a list of components installed locally to the DbProtect server, and components such as scan engines that are remotely installed and registered.Scan Engines settings
See Register a scan engine for detailed instructions for registering scan engines, and Working with scan engines for information about configuring and unregistering scan engines, and updating the SHATTER knowledgebase.Note: The email server you configure must accept messages:
- Sent from the From Address you specify, and from the network locations of all the DbProtect components
- Sent to the addresses you specify (normally addresses in your internal organization)
- Click Edit. The Outgoing Email Server Settings dialog opens.
- Enter the IP address or resolvable name of the SMTP Server.
- Enter the Port number where mail is accepted (normally port 25).
- If a login is required to send mail, enter the User Name and Password.
- (OPTIONAL) Select the Set a limit for email attachments option and type a maximum size in MB to limit the size of email attachments (such as PDF report files).
- (OPTIONAL) Enter addresses in the From and Reply-To fields. If these fields are left blank, the messages will be sent with a blank From Address.
- If you want to send a test email (recommended):
- Click Send test email.
- Type the address in the Test Email Address field.
- Click Send Test Email. The dialog that opens shows whether the message was sent. If the message could not be sent, a new window displays the error.
- To save the configuration, click OK.
Note: DbProtect does not prevent saving of an invalid configuration. Test carefully.
Diagnostics
This tab displays information about the status of DbProtect components.Warehousing
This tab allows you to view the status of data synchronization and warehousing, and to start a manual update or warehousing window.- Click Update Now to push stored updates to your assets, organizations, and policies, without waiting until the scheduled warehousing window starts.
- Click Get data warehouse statistics report to generate a statistical report on the job activities run on your network.
- Click Show Advanced Options | Start Window Now to manually start a warehousing window. All updates to the system from the point forward are published as they occur. If you want to end the window before the updates are complete, click End Current Window.
Licensing
This tab displays the details of licensing for this DbProtect installation. For more information about licensing, refer to the DbProtect Installation and Upgrade Guide. To add a license:- Click Add License to open the Add A License dialog.
- Type or paste the contents of the
ARxx.licorADxx.licfile in the field, and then click Add. - Click Get license utilization report to see a report of license utilization by asset, organization, and usage details.
Appendix A: Monitoring Filter Name Attributes
Name Attributes
The following table includes valid DbProtect name attributes, which are common for all Activity Monitoring expressions across all supported database platforms. DbProtect Name AttributesSQL Server Name Attributes
The following table includes valid Microsoft SQL Server name attributes (for Microsoft SQL Server). An expression can contain SQL Profiler Data Columns, and DbProtect Activity Monitoring-defined values. SQL Server Name Attributes
For more information about SQL Server Profiler Data Columns, see your SQL Server documentation.
DB2 Name Attributes
The following table includes valid DB2 name attributes. An expression can contain these DbProtect Activity Monitoring-defined values.Sybase Name Attributes
The following table includes valid Sybase name attributes. An expression can contain these DbProtect Activity Monitoring-defined values.Oracle Name Attributes
The following table includes valid Oracle name attributes.Appendix B: User Account Privileges Needed for Audit and User Rights Review Scans
Audit policy scans and user rights review scans require read-only access to the asset. While you can use an administrator account to run the scans, it is not required. To set up the appropriate database access on the assets, User Creation Scripts are provided within the product.Note: Audit of some assets is limited to validation of parameters and OS settings. Audit of these assets only requires access to the OS and parameter files and does not require access to the data store itself.
[Asset] is replaced by asset type and version if required):
- CreateUser[Asset].sql: Creates a user called aduser and grants read-only permissions needed to run Audit policy scans
- CreateUser[Asset]URR.sql: Creates a user called aduserURR and grants read-only permissions needed to run Audit policy and User Rights Review scans
- CreatePowerUser[Asset].sql: Creates a user called aduser_admin and grants elevated privileges (for example, SYSDBA for Oracle)
- CreateUser[Asset]SA.sql: Specific to Microsoft SQL Server. Creates a user called aduser and grants sysadmin rights
CheckPermissions.txt file located in the following directory as there are some checks that do require elevated privileges:
Permissions for Unix OS Access
Certain target databases require you to set system variables to specify the location of the database instances.
Target Database Variables for Unix
For Microsoft SQL Server, you can also choose to use Windows Authentication for database credentials. You will need to enter the domain or hostname, username, and password. (for example, if your Windows login is
domain\aduser, you enter ‘domain’ in the Domain or IP/Hostname field, and ‘aduser’ in the User Name field).
Notes:
- If any fields are encrypted and the account used for the Audit policy scan does not have access to those fields, some checks may not work properly.
- Depositor access that only has access to read public documents provides sufficient privileges to run an Audit policy, with the exception of the names database, which requires Reader access.
Appendix C: Sensitive Data Discovery (SDD)
Analyzing Logic
For the Sensitive Data Discovery (SDD) to function, it first needs to analyze the data contained in the target database. This analysis is performed by looking at the database schema for obvious identifiers like a column named “SSN.” For further confirmation of the data contained in a column, the scan will sample the first ten (10) rows of data in the table.Confidence level analysis
- Very Low: when data has multiple types and has no data to verify.
- Low: when data has one type and has no data to verify.
- Medium: when data has only one type and not all values are verified (null or value has both negative and positive matching)
- High: when data has both name and value matches. Most values validated > 50% positive, has no negative matching
- Very High: when data has both name and value matches, and has other related data in the same table or related tables by foreign keys
Sensitivity level analysis
The base sensitivity level is defined by the initial type of sensitive data itself. The analyzer will adjust the sensitivity level based on the relationship between the data. Data is related if they belong to a table or related tables by foreign keys. For example, if there are two tables in a database that are related by foreign key, let us call them “user” and “contact”. These are first identified by the base sensitivity type of the individual data type. The “user” table has the primary key “id” to identify a user, and it also has the column “LastName”. In the second table a “contact” database exists and the column “userId” is defined as a foreign key point that points to column “id” of the table “user”. The second table also defines the address and phone number. Because of the foreign key being defined, the contact information of a customer or user can be identified. For that reason, the sensitivity of the two tables is high, and the columns containing those data types are considered highly sensitive. If there is no foreign key defined, we can have many “LastName” and “Address” columns, but they are disjoined, and the sensitivity is lower.Note: Sensitive level and Confidence level are independent attributes. Sensitive level can be high even if the confidence level is low and vice versa.
SDD reporting
Within a group of sensitive data, the highest confidence level of a sensitive data type will be reported. The lower confidence ones will be dropped.Appendix D: Maintenance and Disaster Recovery
Maintenance Topics
DbProtect has very little need for routine maintenance. Most maintenance is required due to changes in the environment or an unplanned growth of consumed resources. The typical areas of maintenance are highlighted below.Backup and Disaster Recovery
The approaches for backup and recovery vary based on the investment in backup infrastructure and the tolerance of downtime. The different approaches are described below.Bulk Data Management
Results of scan jobs, audits and pen tests, can be exported, imported, and purged from the system. This feature allows exporting scan job results older than a specified cutoff date and, optionally, purging them. When needed, these results can be imported back into DbProtect and will then be available for reporting. Located in theEnterpriseServicesHost\util folder under the product installation directory, three new command line utilities provide these features:
ExportResults.batImportResults.batPurgeResults.bat
Appendix E: Asset Import Example CSV Information
At times it is easier to import assets, compared to manual creation, when there are a large number of records. This information is also contained in the DbProtect Assets page when you click Import and then the hyperlink for “View Sample File” on the top right. This is a sample asset import file for DbProtect 6.5 and later. It is recommended to test your import file content before you run an import by clicking the Test Import button in the Import dialog. Asset imports require the following columns:- host
- port
- instanceName
- assetType
- pipeName: overrides the default pipe name for Microsoft SQL Server connections. This credential type should specify ‘Named Pipe’ as the network protocol.
- oracleServiceName: specifies a service name to be used for connecting to an Oracle asset.
- scanGroup: specifies a scan group for this asset. Only scanners belonging to the specified scan group will be used for scanning this asset. This only applies if scan groups have been configured under Set Up | System Settings | Scan Engines.
- assetGroup: Specifies a group for this asset.