The USM Anywhere System Monitor page enables the user whose role is manager to display statistics of the data coming from sensors inside a time-frame. See Role-Based Access Control (RBAC) in USM Anywhere for more information.
You can choose between the last 24 or 7 hours. If you have more than one sensor configured in your environment, you need to select a sensor.
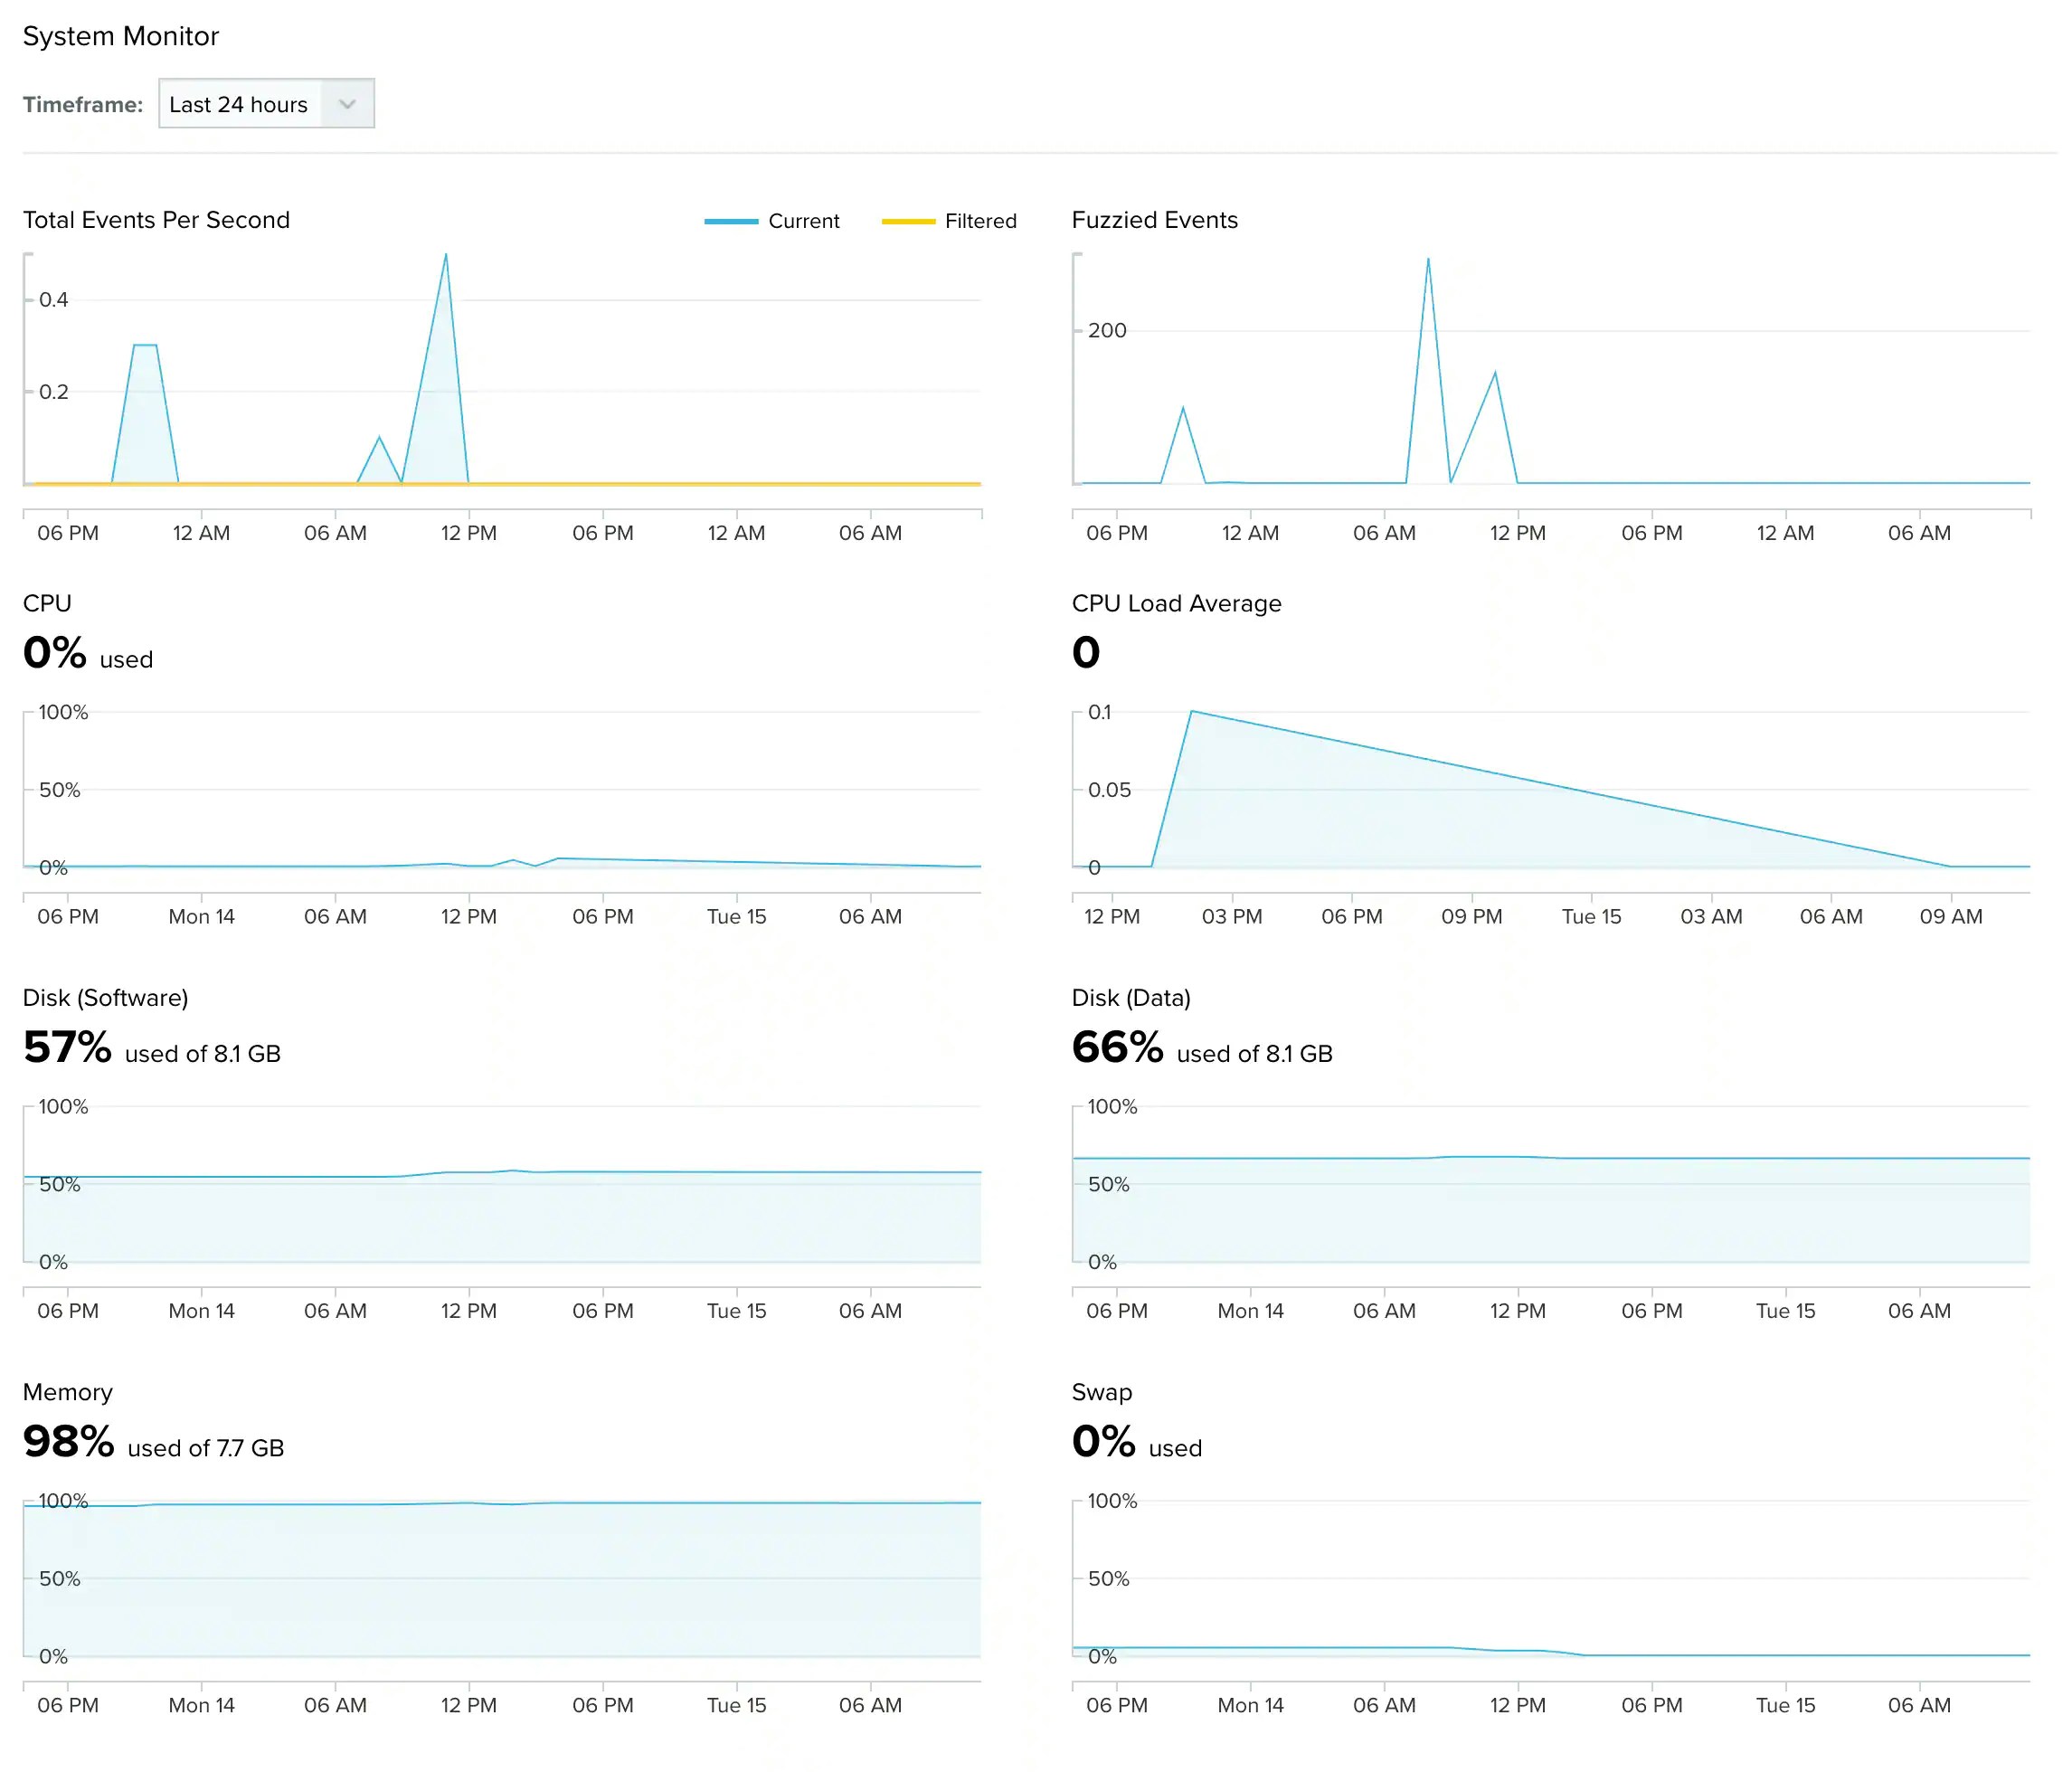
Go to Settings > System, and then click System Monitor in the left navigation panel. These are the displayed data: