

 icon to hide the filter pane. Click the
  icon to expand the filter pane.
The following table displays the list of the default columns found in the List view.
List of the Default Columns in Configuration Issues
icon to expand the filter pane.
The following table displays the list of the default columns found in the List view.
List of the Default Columns in Configuration Issues
Click the
 icon to access these options:
- Add to current filter: Use this option to add the asset name as a search filter.
- Look up in OTX: This option searches the IP address of the asset in the LevelBlue LevelBlue Labs Open Threat Exchange® (OTX™) page. See Using OTX in USM Anywhere for more information.
- Full Details: See Viewing Assets Details for more information.
 icon to bookmark an item for quick access.
You can view your bookmarked items by going to the secondary menu and clicking the icon. This will display all of your bookmarked items and provide direct links to each of them.
icon. This will display all of your bookmarked items and provide direct links to each of them.Views
USM Central enables you to define and save a custom Configuration Issues view to have your own selected filters. You can configure the view you want for the list of items in the page. To create a view configuration- From the list view, select the filters you want to apply.
-
Go to Save View > Save As.
The Save Current View dialog box opens.
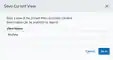
- Enter a name for the view.
- Click Save. The created view is already selected.
- From the ist view, click View above the filters.
- Click Saved Views, and then select the view you want to see.
- Click Apply.
- From the Configuration Issues list view, click View above the filters.
-
Click Saved Views, and then click the
 icon next to the saved view you want to delete.
A Settings Delete dialog box opens to confirm the deletion.
icon next to the saved view you want to delete.
A Settings Delete dialog box opens to confirm the deletion.
-
Click Accept.
The icon does not display if the view is selected.
You can only delete the views you have created.