Security Continuous Monitoring (DE.CM): The information system and assets are monitored at discrete intervals to identify cybersecurity events and verify the effectiveness of protective measures. Since all events can be attributed to user events, and all events are run through the correlation engine, this control is satisfied by the default view.
Associated Frameworks: ISA 62443-3-3:2013 SR 6.2, ISO/IEC 27001:2013 A.12.4.1, NIST SP 800-53 Rev. 4 AC-2, AU-12, AU-13, CA-7, CM-10, CM-11
The report provides information on all events that have been tagged to be malicious.
Filters used by NIST CSF Malware_variant Control DE.CM-4: Malicious Code is Detected
To generate NIST CSF Malware_variant Control DE.CM-4 report
- Go to Reports > Compliance Templates.
- On the left navigation pane, click NIST CSF.
- Click Generate Report on the specific line for this report. The Configure Report dialog box appears.
- Click Edit Filters if you want to modify the selected filters, and then click Continue to Filters.
- Make the required modifications, and then click Edit Report.
-
Click the date field if you want to choose a different date range. Select Last Hour, Last 24 Hours, Last 7 Days, Last 30 Days, Last 90 Days, or Custom Range to set a particular date range.
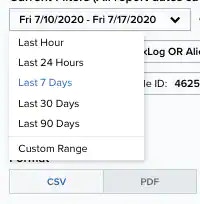
- Select the Format of the report. It can either be CSV or PDF.
- Select a Schedule for the report if you want to generate it again: Daily, Weekly, Bi-weekly, and Monthly. Otherwise, select Never.
- Enter an email address in which to send the report. You may also select the Send to my Email Address option to add your email address automatically.
-
Select the Enable link expiration option.
This link is delivered by email and expires in 14 days.
- Click Next.
- In the Report Name field, enter a name for the report. This name will be displayed on the Saved Reports page.
- (OPTIONAL) Enter a Report Description.
- Under the Number of Records section, select the maximum number of records to include in the report: 20, 50, 100, 500, 1000, or 2500.
-
If you have previously chosen the PDF format, you will see the Graphs section, which you can use to include additional views. You can add to or remove graphs from the report by clicking the
 and
and  icons.
- Click Run to run the report.