This dashboard includes three separate sections.
SIEM Section
security intelligence combines and correlates collected logs and other data to find patterns in network traffic and within activity.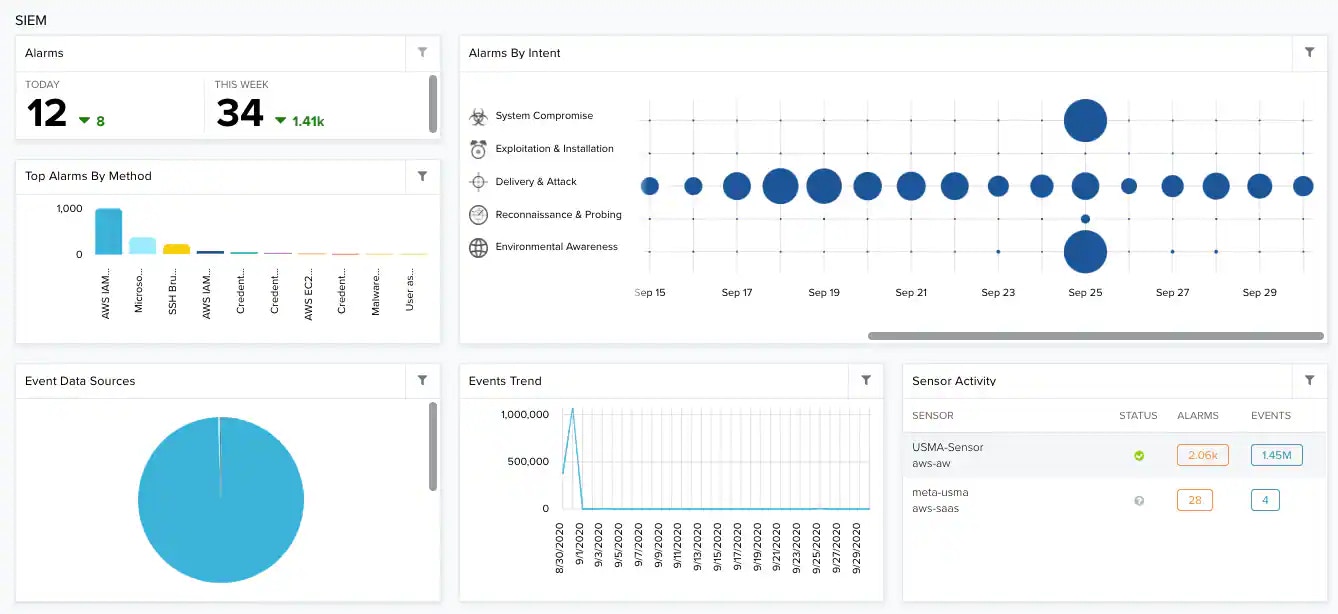
Asset Discovery Section
Discovery discovers assets in your environment, detects changes in assets, and discovers malicious assets in the network.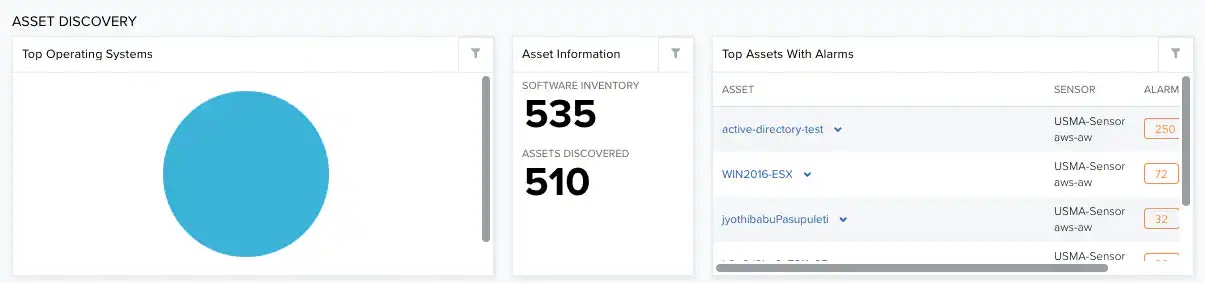
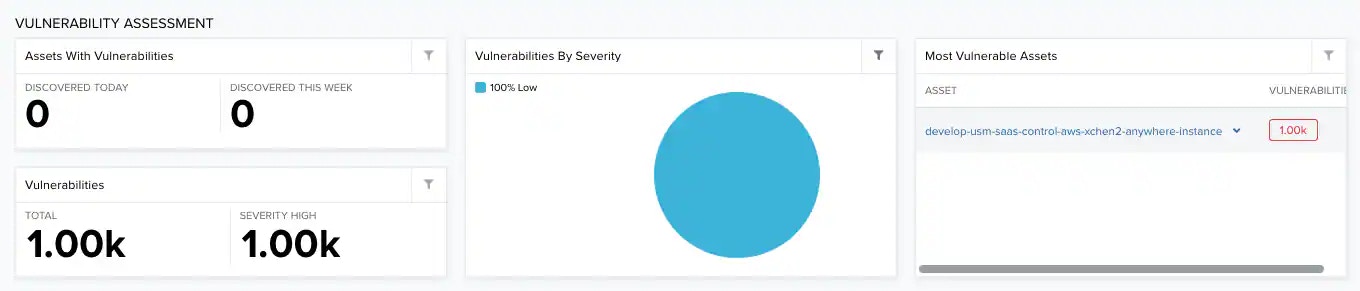
Vulnerability Assessment Section
identify vulnerabilities or compliance by comparing the installed software on assets with a database of known vulnerabilities.