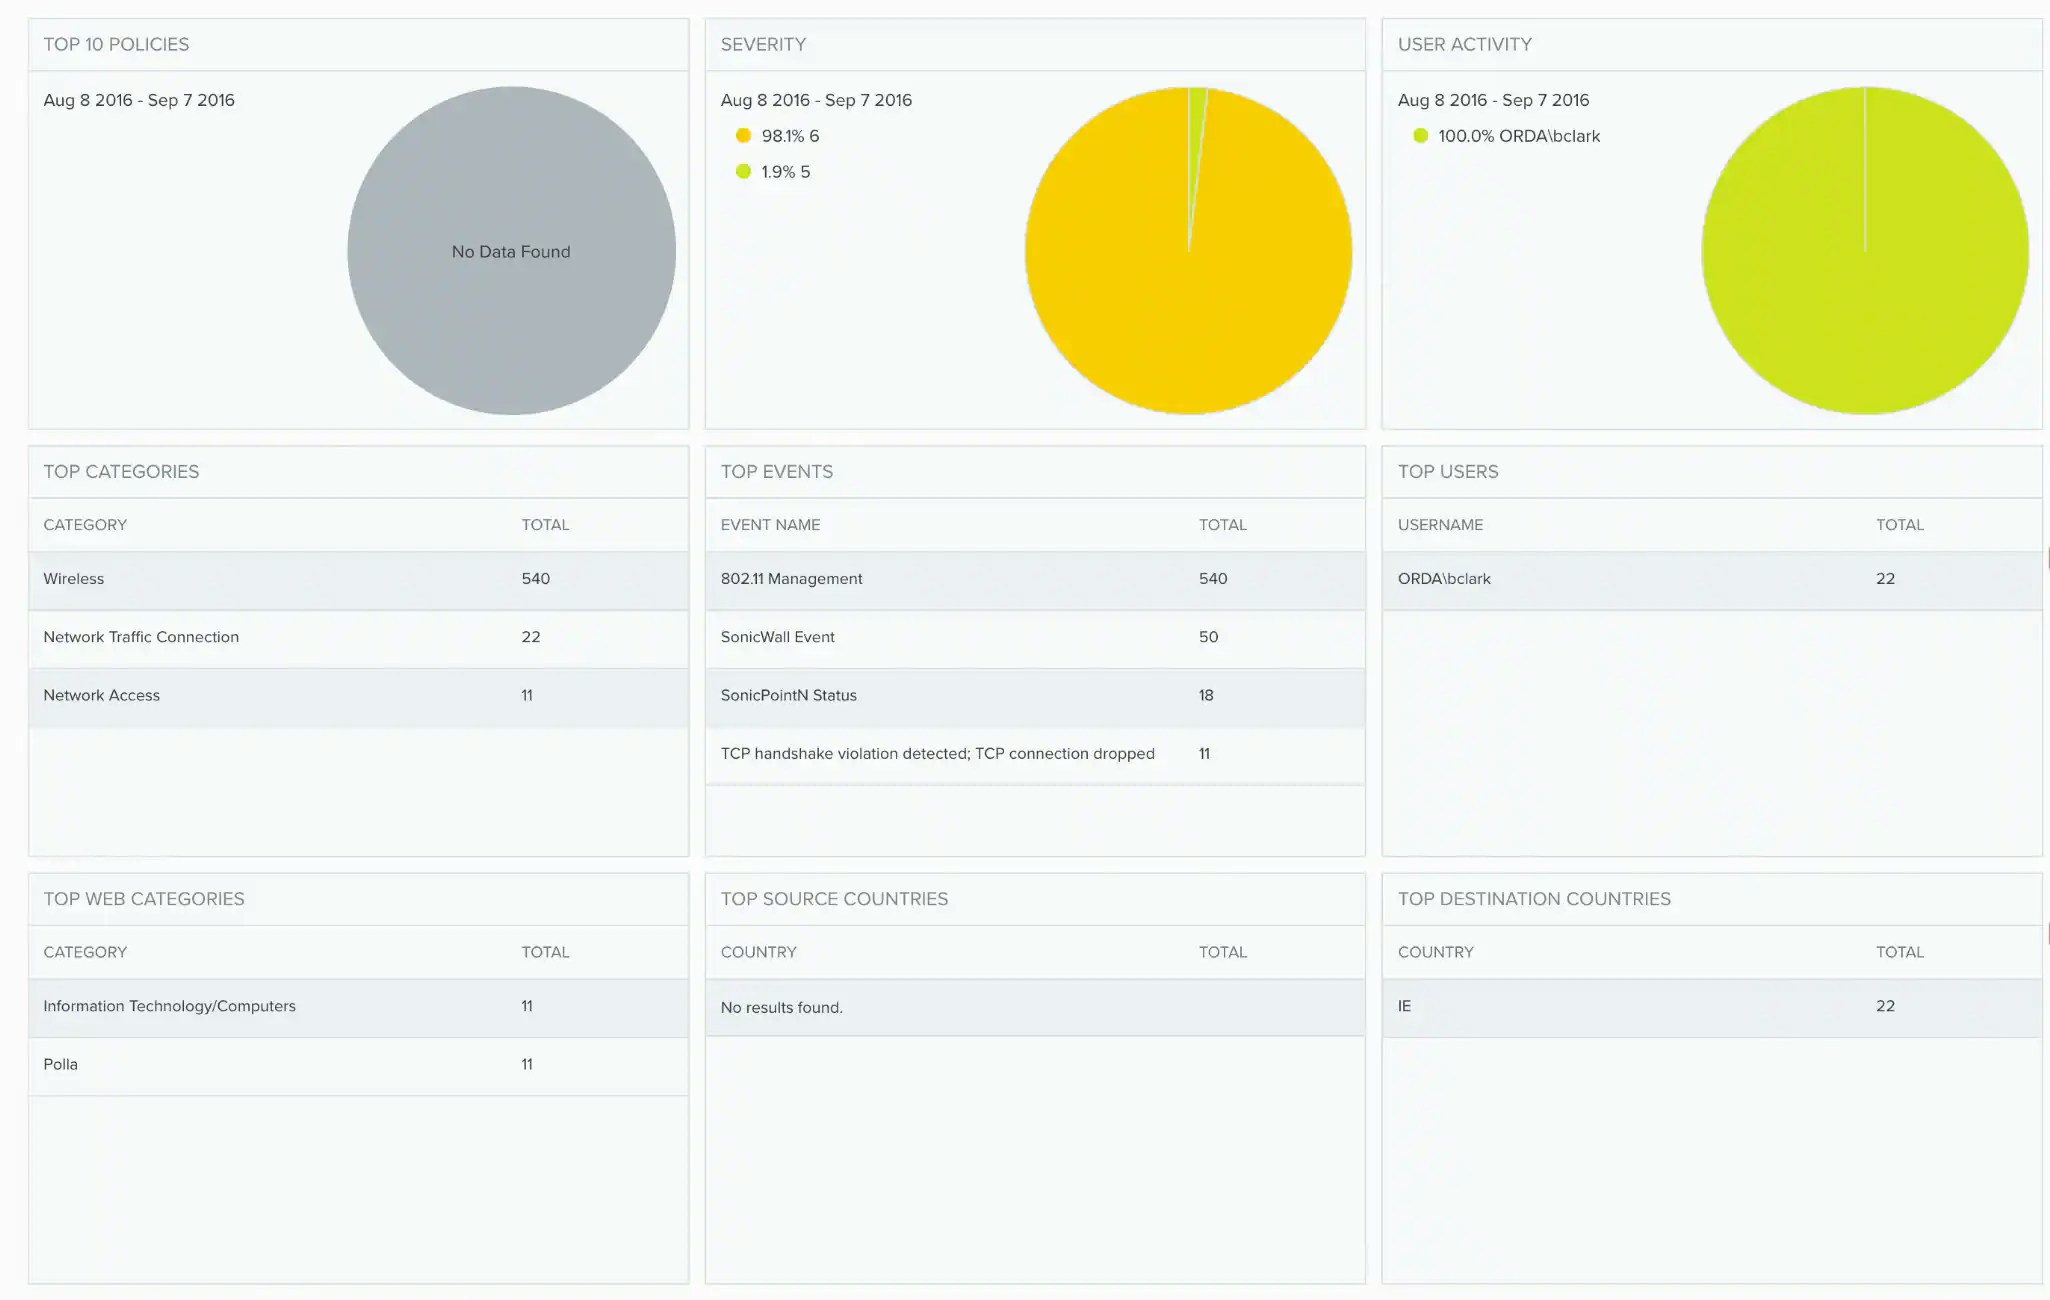
Depending on the USM Anywhere Sensor you have installed, the widgets might be visible in the SonicWall dashboard. This dashboard displays data when the SonicWall data source has been configured.
Widgets in the SonicWall Dashboard
Widget
Description
Top 10 Policies
Pie chart displaying, in percentages, the top ten SonicWall policies.
Severity
Pie chart displaying, in percentages, the top event severity.
User Activity
Pie chart displaying, in percentages, the top users by activity.
Top Categories
List of the top categories expressed in total numbers.
Top Events
List of the top SonicWall events expressed in total numbers.
Top Users
List of the top users expressed in total numbers.
Top Web Categories
List of the top web categories expressed in total numbers.
Top Source Countries
List of the top source countries expressed in total numbers.
Top Destination Countries
List of the top destination countries expressed in total numbers.