The MobileIron Threat Defense dashboard displays data when the MobileIron Threat Defense (MTD) source has been configured and includes MobileIron events. See BlueApp for MobileIron Threat Defense for more information.
Widgets in the MobileIron Threat Defense Dashboard
Widget
Description
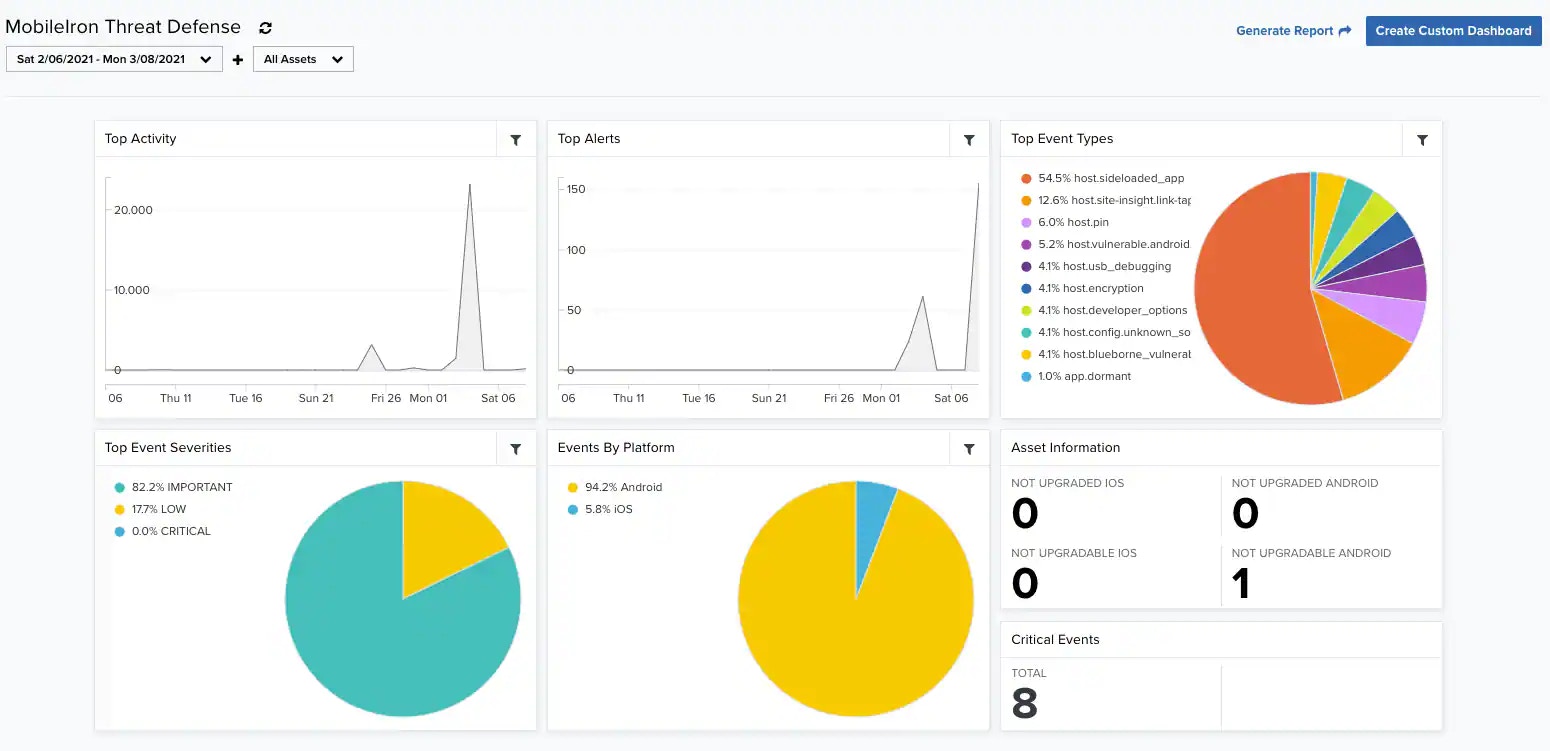
Top Activity
Graph that shows the number of events over a period of time.
Top Alerts
Graph that shows the number of alarms over a period of time.
Top Event Types
Pie chart displaying, in percentages, the top events types related to the MTD.
Top Event Severities
Pie chart displaying, in percentages, the top events severities related to the MTD.
Events by Platform
Pie chart displaying, in percentages, the top events by platform related to the MTD.
Asset Information
Total number of assets having not upgraded Apple iOS, not upgraded Android, not upgradable iOS, and not upgradable Android.