Role AvailabilityRead-OnlyInvestigatorAnalystManager
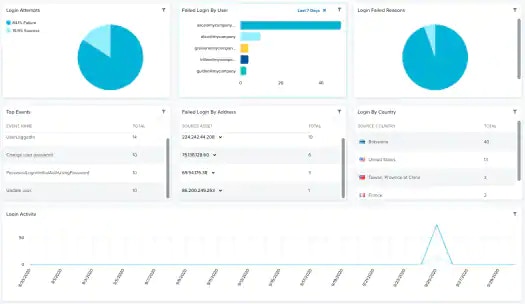
Depending on the USM Anywhere Sensor you have installed, the widgets might be visible in the Microsoft Azure Active Directory (AD) dashboard. This dashboard displays a summary of the events originating from the Azure AD logs, so your environment must have configured the Azure AD data source. See BlueApp for Office 365 for more information.
Widgets in the Office 365 Azure Active Directory Dashboard\
WidgetDescription
Login AttemptsPie chart displaying, in percentages, the successful and unsuccessful login attempts to Office 365 Azure Active Directory.
Failed Login By UserList of the 5 failed login by user.
Login Failed ReasonsPie chart displaying, in percentages, the reasons of the failed login.
Top EventsList of top events detected by Office 365 Azure Active Directory.
Failed Login By AddressList of the 5 failed login in Office 365 Azure Active Directory by address.
Login By CountryList of the 5 login in Office 365 Azure Active Directory by country.
Login ActivityGraph that displays the successful and unsuccessful login attempts to Office 365 Azure Active Directory.
I