The Microsoft Windows dashboard will have data when your environment includes NXLog Windows events, Microsoft Azure Windows events, Elastic Winlogbeat Windows events, or LevelBlue Agent - Windows EventLog events.Widgets in the Windows Dashboard
Widgets
Description
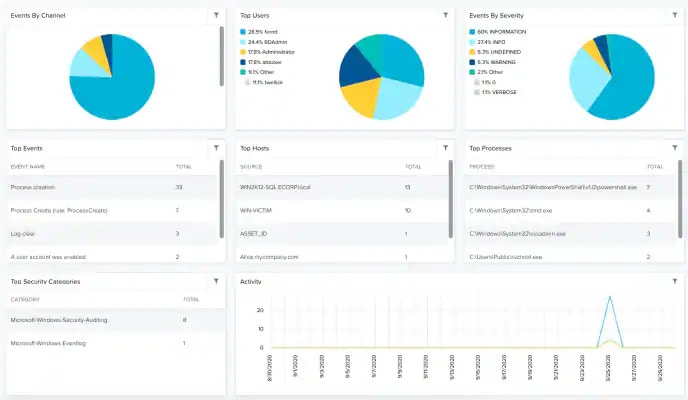
Events by Channel
Pie chart containing the different channels populating the Windows Event Log. For example: System, Security or Application.
Top Users
Pie chart containing percentage of Windows Event Logs per user.
Events by Severity
Pie chart containing percentage of Windows Event Log per severity.
Top Events
Displays a list of top Windows Events.
Top Hosts
Top Windows hosts based on Windows Event Logs generated.
Top Processes
Displays a list of the top Windows processes.
Top Security Categories
Displays a list of security categories.
Activity
Timeline graph displaying Windows activity by event category.