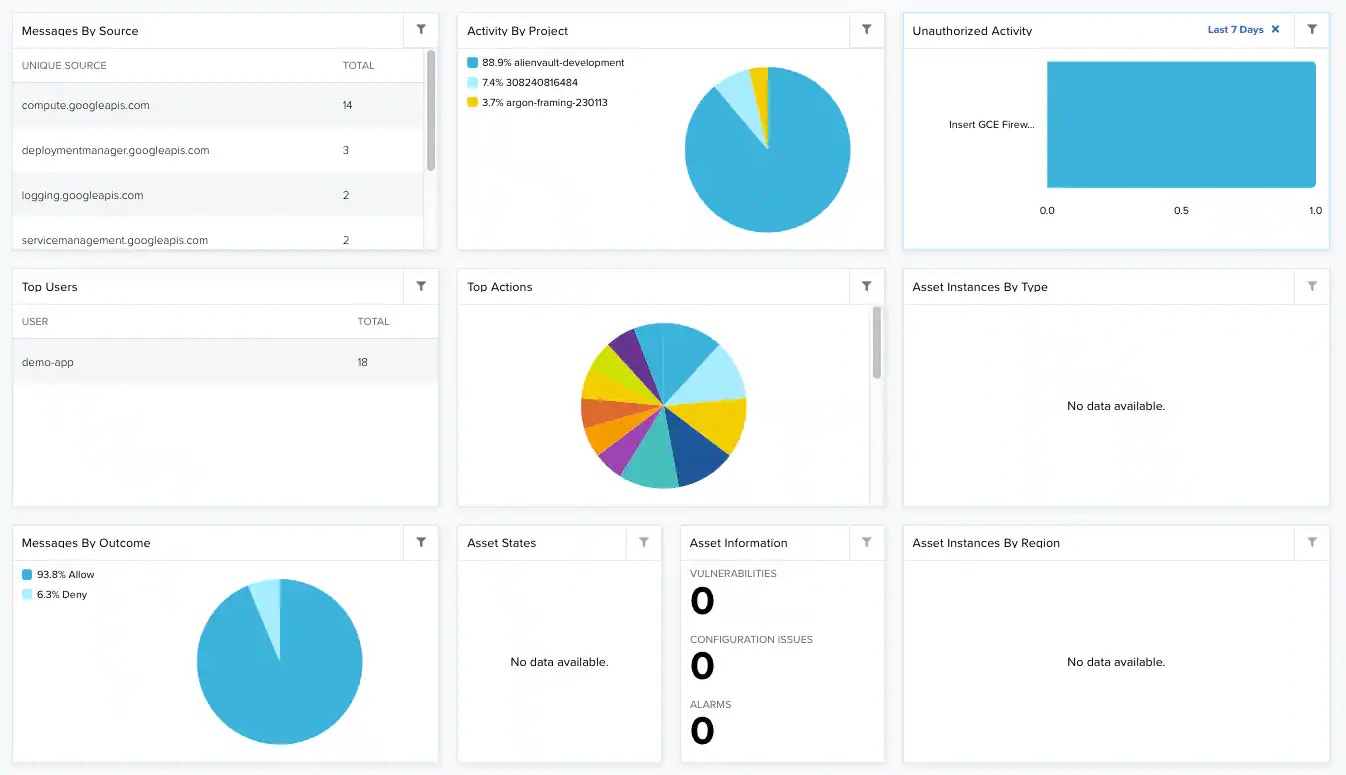
Depending on the USM Anywhere Sensor you have installed, the widgets might be visible in the Google Cloud Platform dashboard. This dashboard displays data when the Google Cloud Audit data source has been configured.
Widgets in Google Cloud Platform Dashboard
Widget
Description
Messages by Source
List of the top sources receiving the most messages.
Activity by Project
Pie chart displaying, in percentages, the top projects with the most activity.
Unauthorized Activity
List of the unauthorized activity.
Top Users
List of the top users.
Top Actions
Pie chart displaying the top actions in Google Cloud Platform.
Asset Instances by Type
List of instances ordered by type.
Messages by Outcome
Pie chart displaying, in percentages, the outcome for access control, which can be Allow or Deny.
Asset States
List of the state of the assets and the total number at each asset.