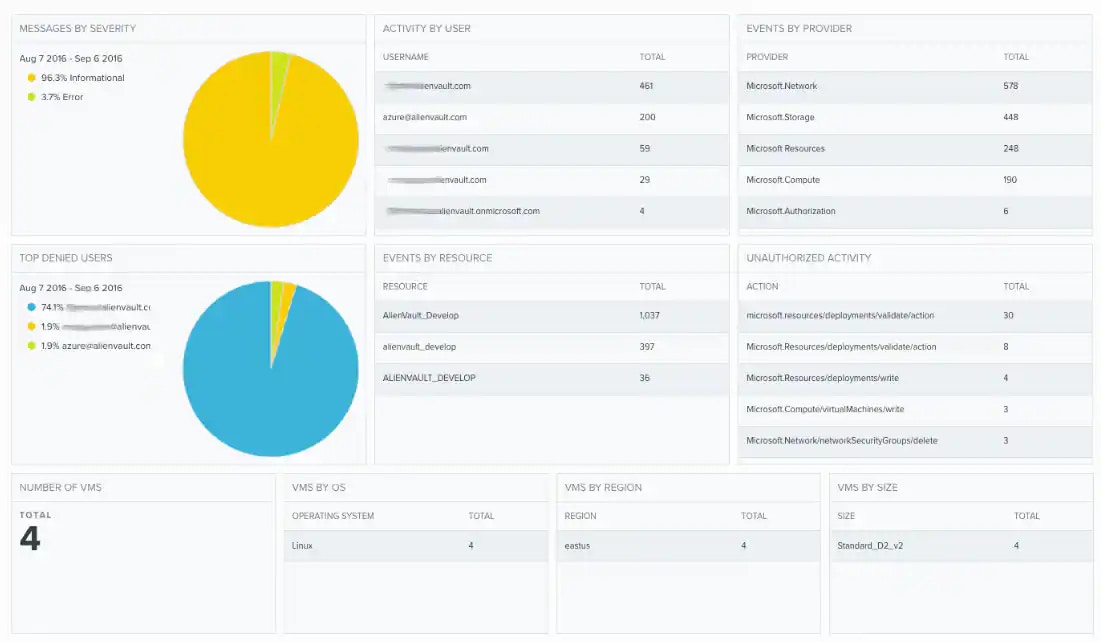
Depending on the USM Anywhere Sensor you have installed, the widgets might be visible in the Microsoft Azure dashboard. This dashboard displays data when the Azure Cloud data source has been configured.
Widgets in the Azure Dashboard
Widget
Description
Messages by Severity
Pie chart displaying, in percentages, the received messages by severity.
Activity by User
List of the top five usernames with the most activity.
Events by Provider
List of the events by provider.
Top Denied Users
List of the top-denied users.
Events by Resource
List of the events by resource.
Unauthorized Activity
List of the unauthorized activity.
Number of VMs
Total number of virtual machines (VMs) installed.
VMs by OS
Total number of virtual machines (VMs) installed by operating system (OS).
VMs by Region
Total number of virtual machines (VMs) installed by region.
VMs by Size
Total number of virtual machines (VMs) installed by size.