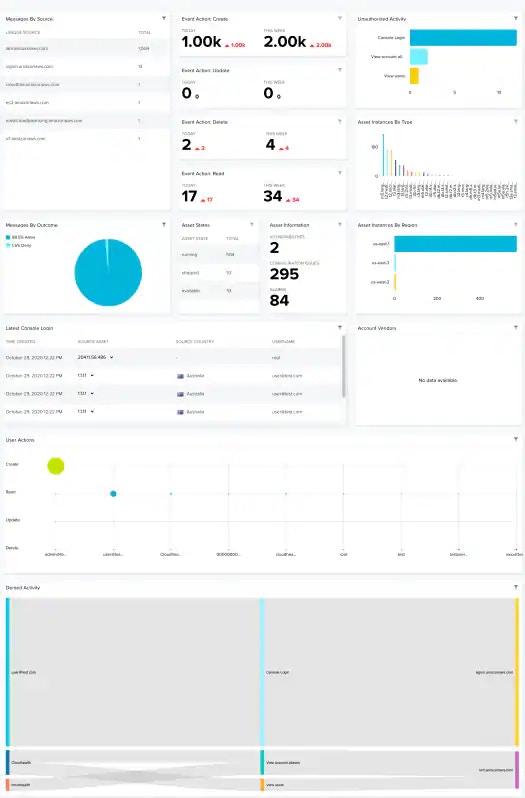
Depending on the USM Anywhere Sensor you have installed, the widgets might be visible in the Amazon Web Services dashboard. This dashboard displays data when the Amazon Web Services (AWS) CloudTraildata source has been configured.
Widgets in the Dashboard
Widget
Description
Messages by Source
List of the fifteen receiving the most messages.
Event Action: Create
Total number of assets created for the current day and for the current week.
Event Action: Update
Total number of assets updated for the current day and for the current week.
Event Action: Delete
Total number of assets deleted for the current day and for the current week.
Event Action: Read
Total number of assets read for the current day and for the current week.
Unauthorized Activity
List of the unauthorized activity that has been made on .
Asset Instances by Type
List of asset instances ordered by type.
Messages by Outcome
Pie chart displaying, in percentages, the outcome for access control, which can be Allow or Deny.
Asset States
List of the state of the assets and the total number at each state.
Asset Information
Total number of assets having , , and .
Asset Instances by Region
Total number of asset instances by region.
Latest Console Login
Date of the latest console .
Account Vendors
Pie chart displaying, in percentages, the known vendor services in AWS.
User Actions
Users related to the implied action of the event, which can be create, read, update, and delete. The size of the bubbles depends on the number of issues.
Denied Activity
Sankey diagram which displays the source username, the event name, and the data in which the events were received.