This dashboard will have data when your environment has deployed agents on the assets. See The LevelBlue Agent for more information.
Widgets in the LevelBlue Agent Dashboard
Widget
Description
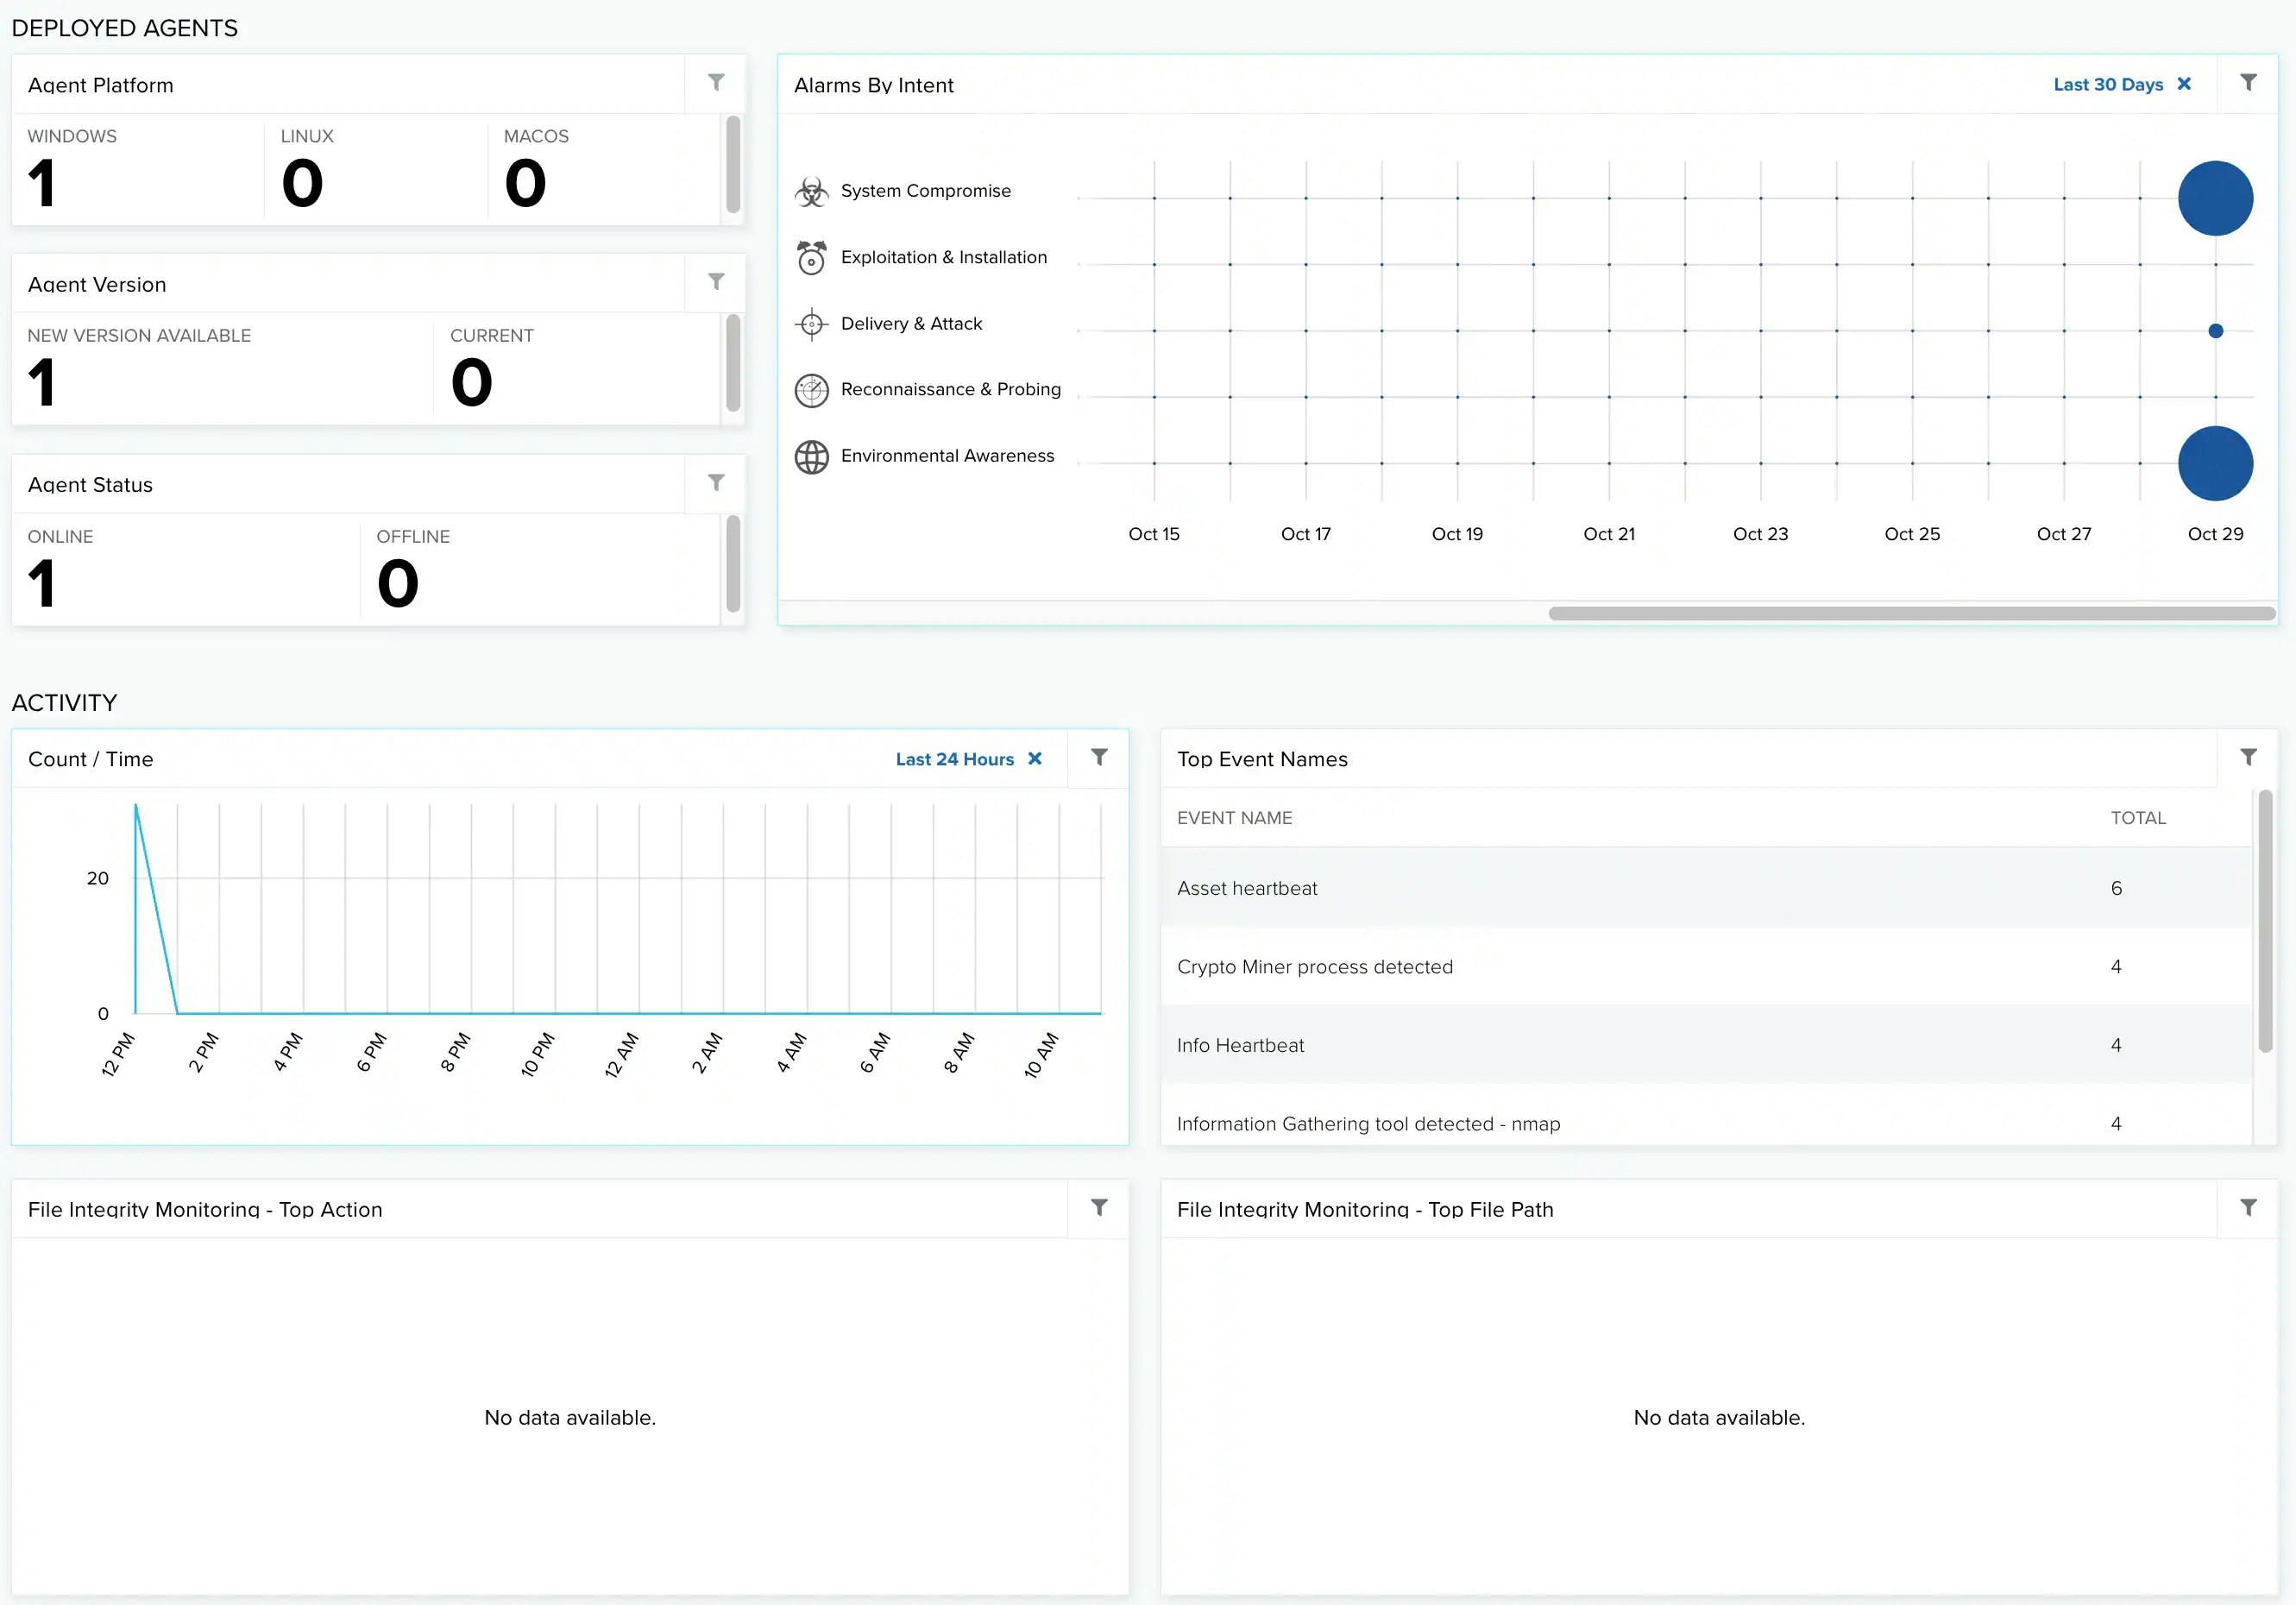
Agent Platform
Total number of assets with a deployed agent by platform, Windows, macOS, and Linux.
Agent Version
Total number of agents with the current version installed, and the total number of agents that can be updated to a new version using the The LevelBlue Agent Script and Agent Updates.
Agent Status
Total number of agents that are online and offline.
Alarms By Intent
Alarms correlated by intent and related to a range of dates. The size of the bubbles depends on the number of issues.
Count/Time
Graph that shows the number of events over a period of time.
Top Event Names
List of the top events related to the agent.
File Integrity Monitoring — Top Action
Pie chart displaying, in percentages, the top actions based on integrity changes on those systems.
File Integrity Monitoring — Top File Path
List of the top file path based on integrity changes on those systems.