Depending on the USM Anywhere Sensor you have installed, the widgets might be visible in the Fortinet FortiGate dashboard. This dashboard displays data when the FortiGate data source has been configured.
Widgets in the FortiGate Dashboard
Widget
Description
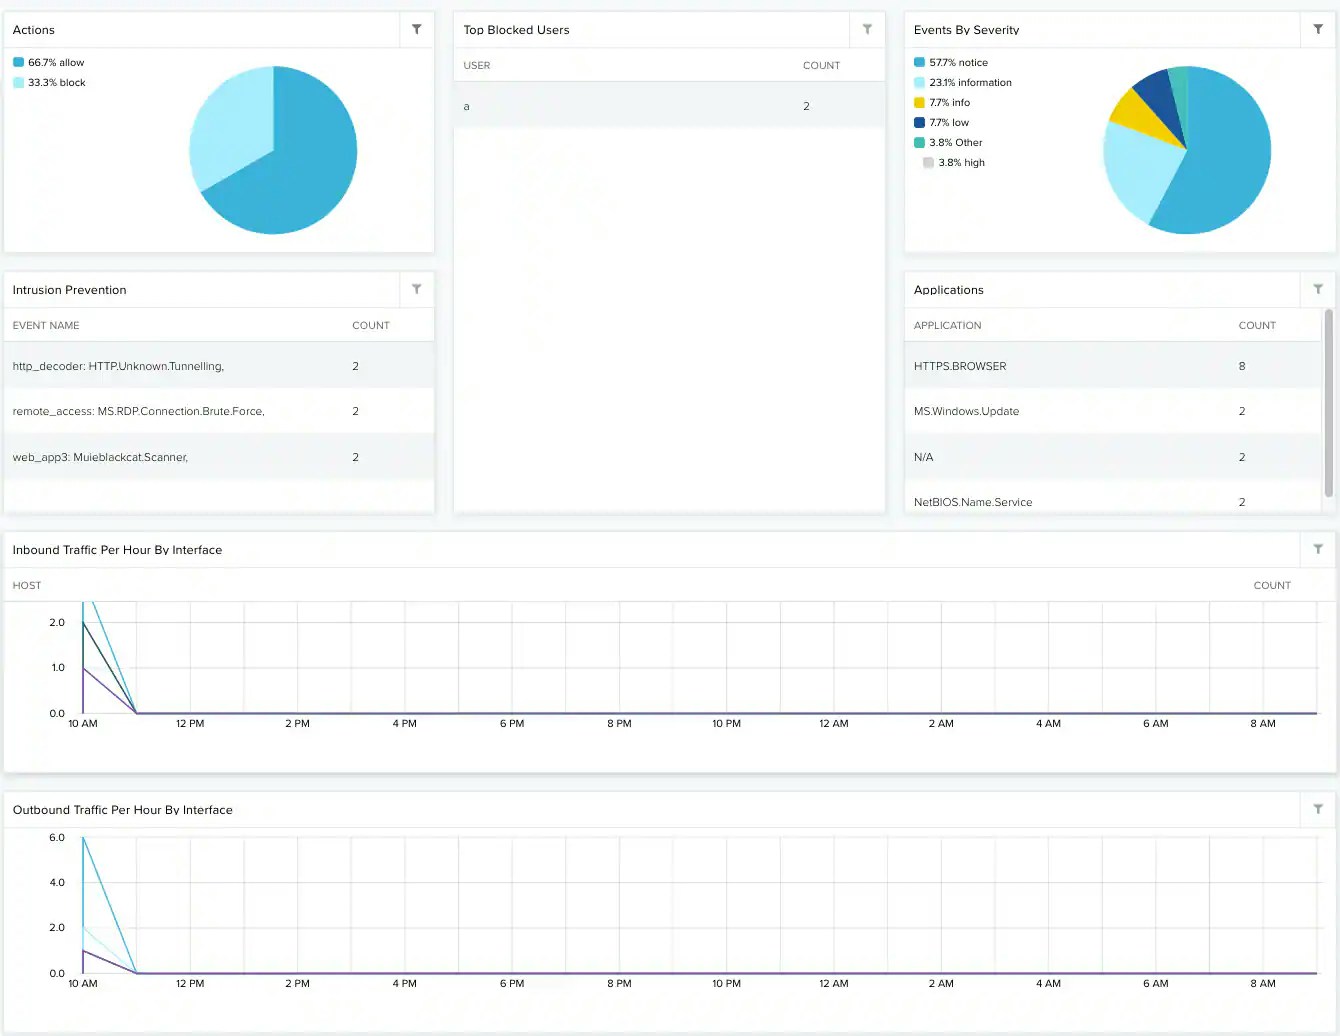
Actions
Pie chart displaying, in percentages, the actions supported by FortiGate.
Intrusion Prevention
List of the ten top intrusion prevention events.
Top Blocked Users
List of the five top blocked users by FortiGate.
Events by Severity
Pie chart containing percentage of FortiGate events by severity.
Applications
List of the ten top applications detected in the events.
Inbound Traffic Per Hour by Interface
Graph that displays the inbound traffic per hour and by interface.
Outbound traffic Per Hour by Interface
Graph that displays the outbound traffic per hour and by interface.