Depending on the USM Anywhere Sensor you have installed, the widgets might be visible in the McAfee ePO dashboard. This dashboard displays data when the McAfee ePO data source has been configured. See BlueApp for McAfee ePO for more information.
Widgets in the McAfee ePO Dashboard
Widget
Description
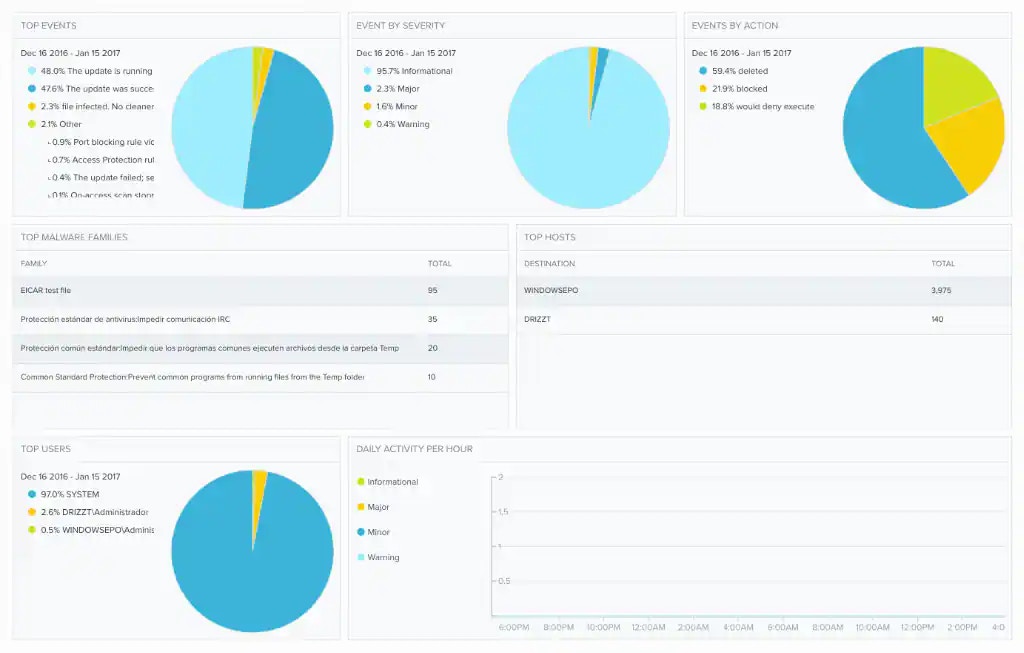
Top Events
Pie chart displaying, in percentages, the top events detected by McAfee ePO.
Event by Severity
Pie chart containing percentage of McAfee ePO per severity.
Events by Action
Pie chart displaying, in percentages, the events detected by action.
Top Malware Families
List of the top malware families expressed in total numbers.
Top Hosts
List of top hosts expressed in total numbers.
Top Users
Pie chart containing percentage of McAfee ePO logs per user.
Daily Activity Per Hour
Graph that displays the daily activity of McAfee ePO per hour.