Role AvailabilityRead-OnlyInvestigatorAnalystManager
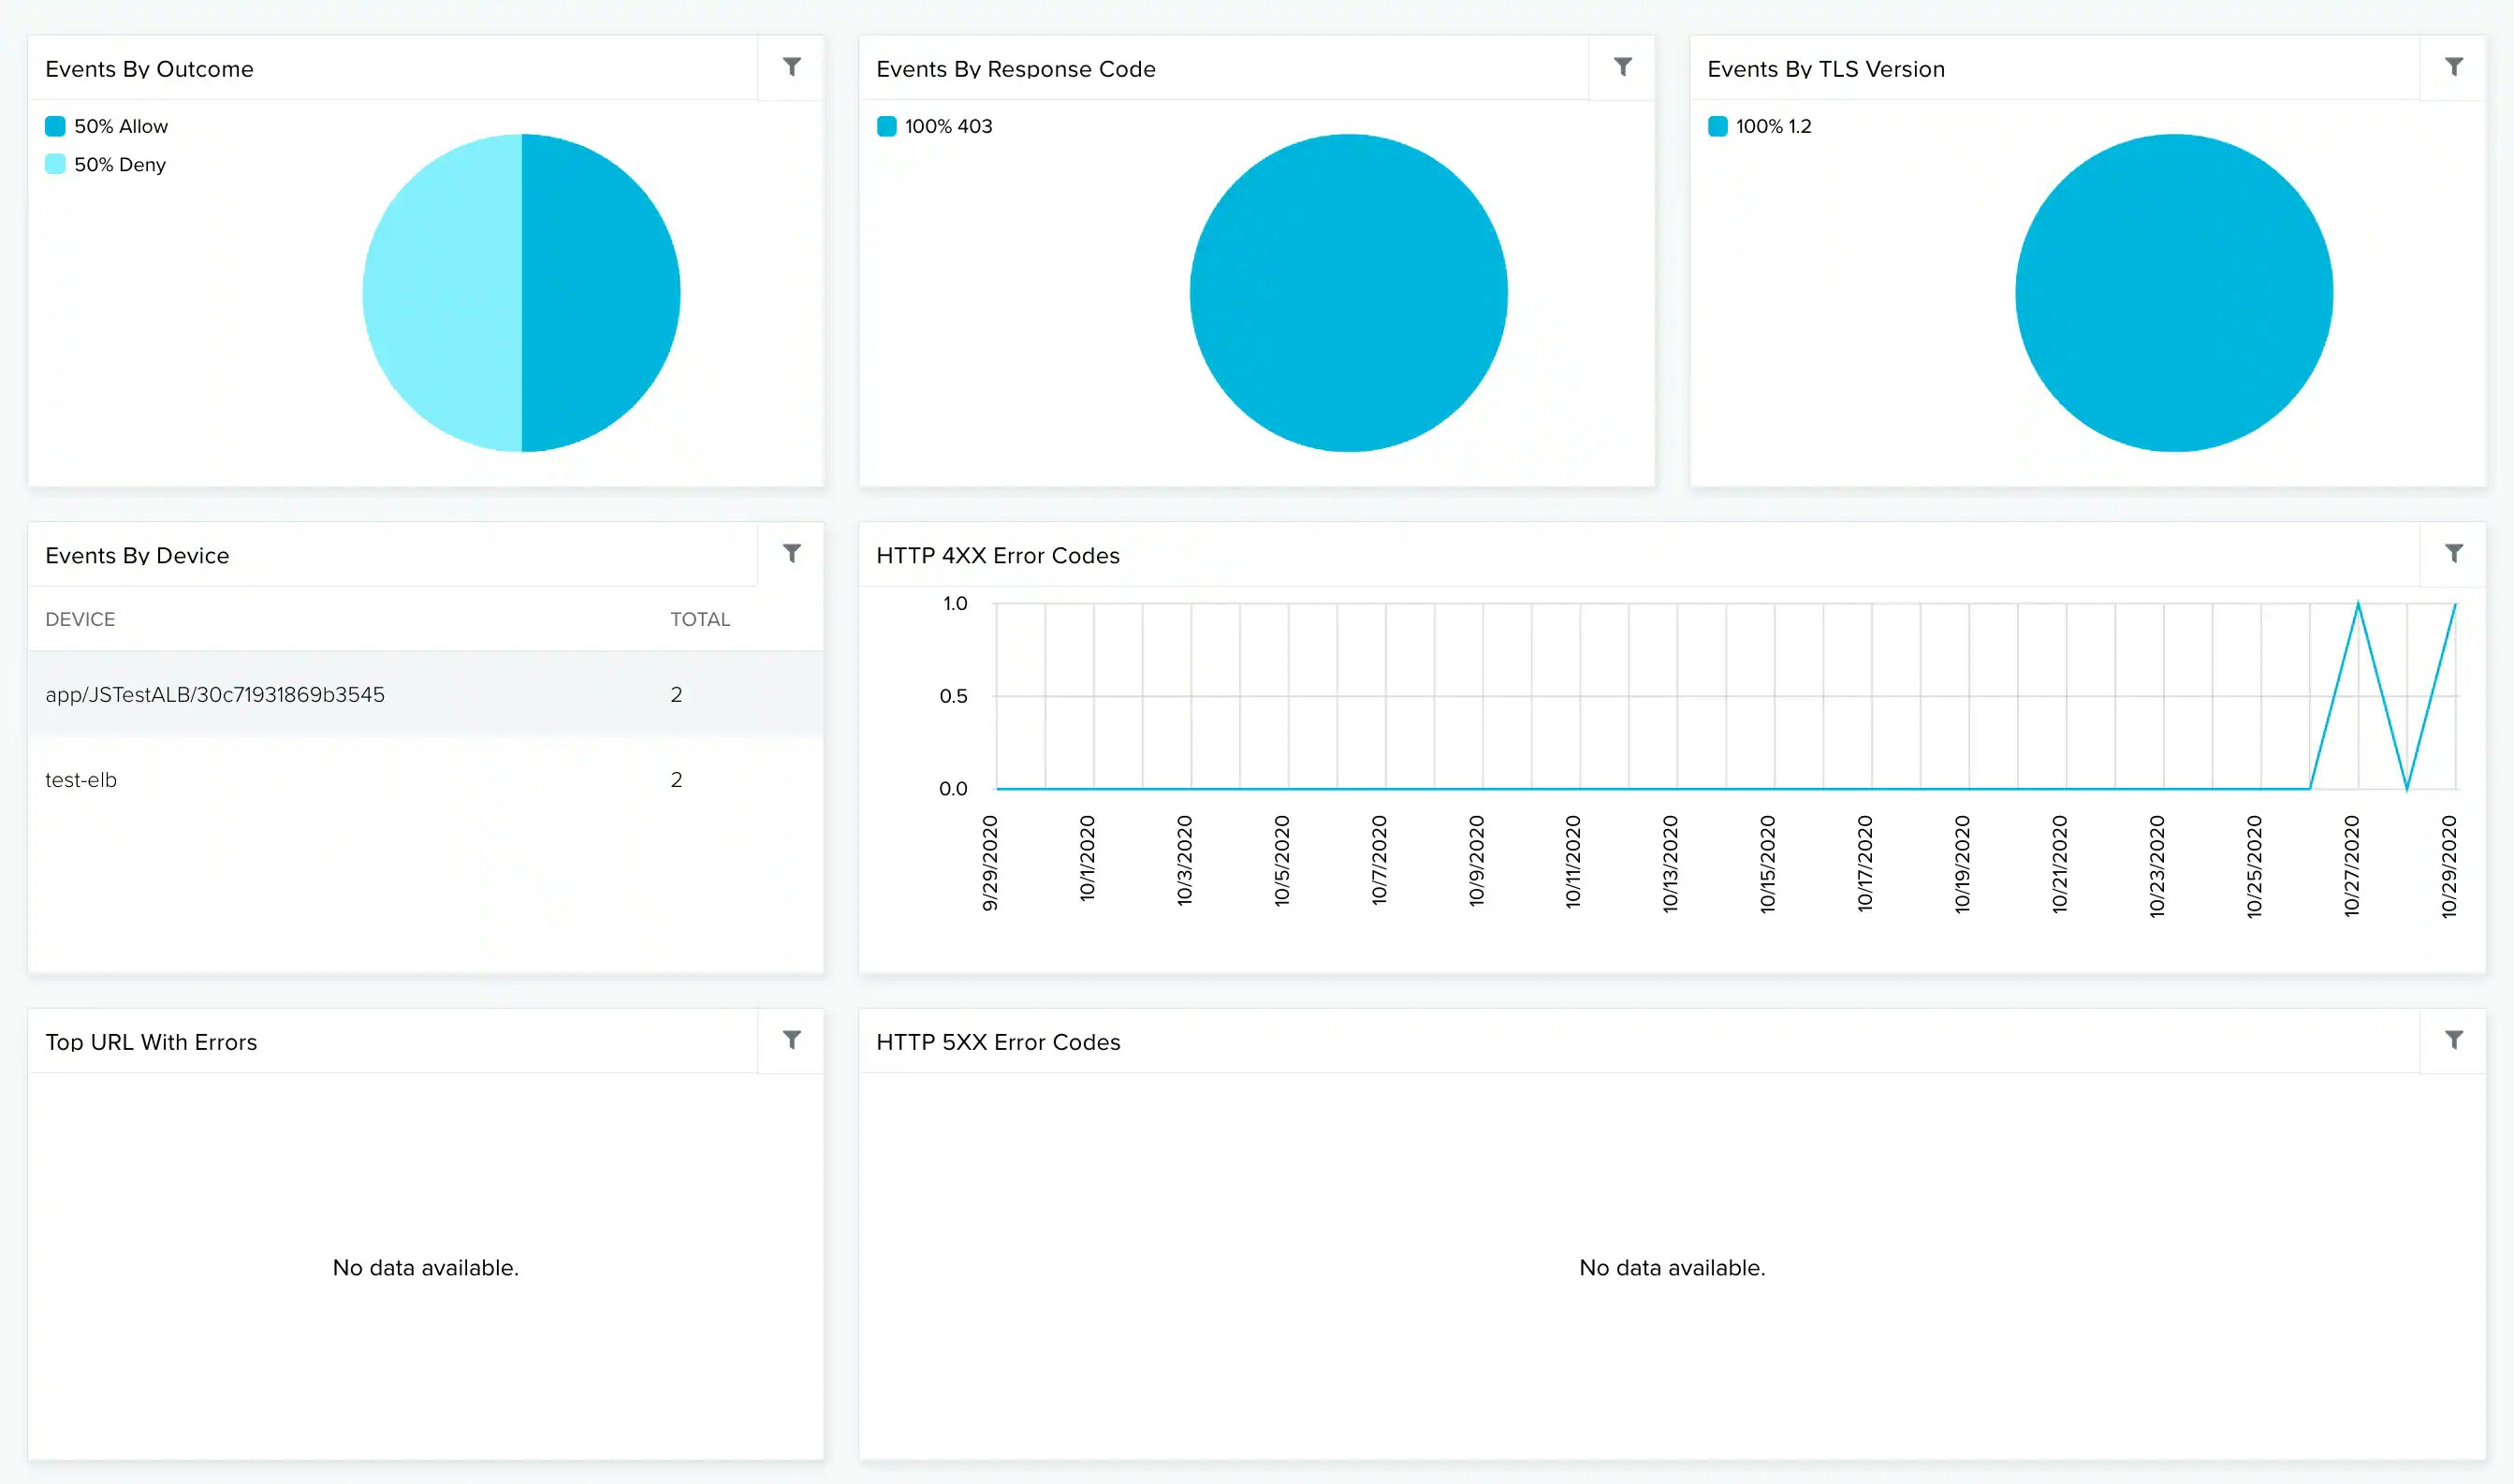
Depending on the USM Anywhere Sensor you have installed, the widgets might be visible in the Amazon Web Services (AWS) Load Balancer dashboard. This dashboard displays data when the ELBAccess data source has been configured or your environment has the AWS Application Load Balancer installed. See Collect ELB Access Logs for more information.
Widgets in the AWS Load Balancer Dashboard
WidgetDescription
Events by OutcomePie chart displaying, in percentages, the top AWS Load Balancer events ordered by outcome.
Events by Response CodePie chart displaying, in percentages, the main events by response code.
Events by TLS VersionPie chart displaying, in percentages, the main events by Transport Layer Security (TLS) Version.
Events by DeviceList of the main events by device.
HTTP 4xx Error CodesGraph that displays the HTTP 4xx error codes by periods of time.
Top URL with ErrorsList of the top URL with errors.
HTTP 5xx Error CodesGraph that displays the HTTP 5xx error codes by periods of time.
I