
Documentation Index

Fetch the complete documentation index at: https://docs.levelblue.com/llms.txt

Use this file to discover all available pages before exploring further.

Role AvailabilityRead-OnlyInvestigatorAnalystManager
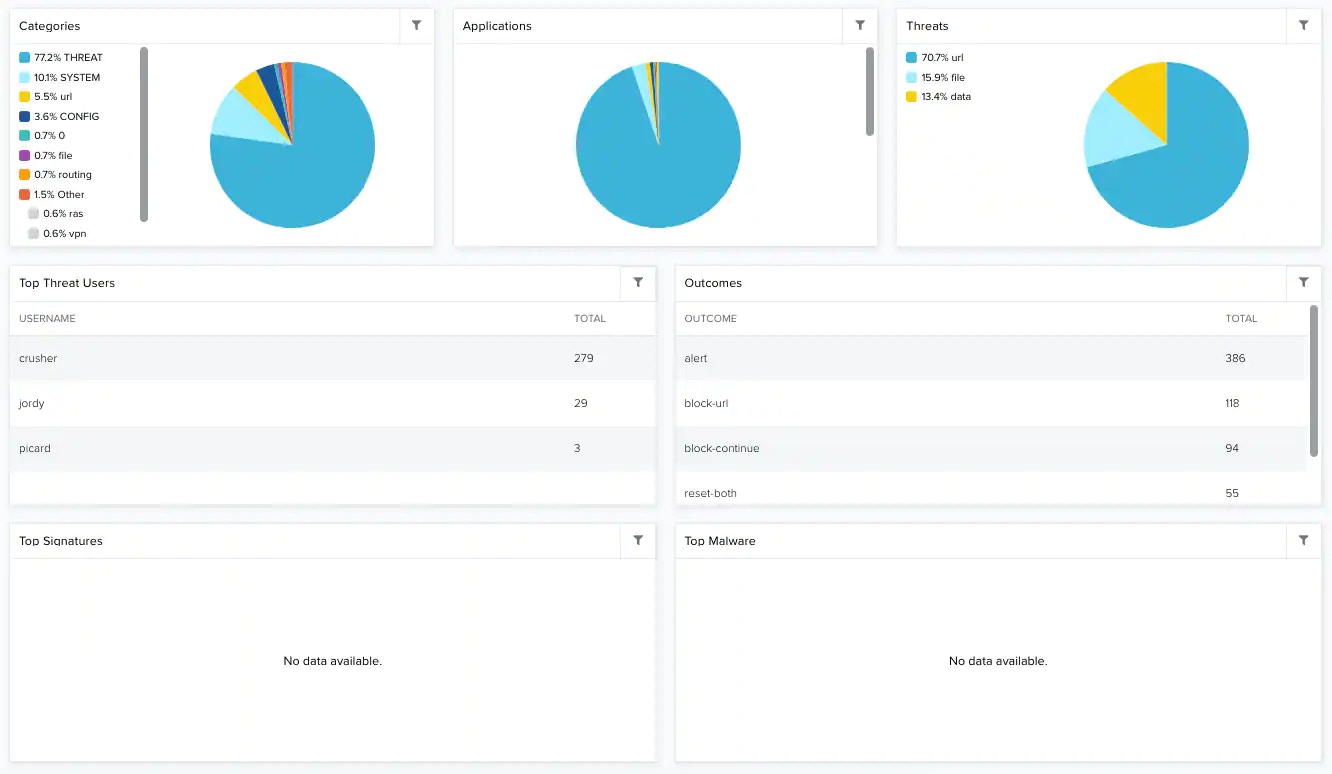
Depending on the USM Anywhere Sensor you have installed, the widgets might be visible in the Palo Alto Networks dashboard. This dashboard displays data when the Palo Alto PAN-OS data source has been configured. See BlueApp for Palo Alto Networks PAN-OS for more information.
Widgets in the Palo Alto Networks Dashboard
WidgetDescription
CategoriesPie chart displaying, in percentages, the Palo Alto Networks categories.
ApplicationsPie chart displaying, in percentages, the Palo Alto Networks applications.
ThreatsPie chart displaying, in percentages, the threats detected by Palo Alto Networks.
Top Thread UsersList of the top thread users expressed in total numbers.
OutcomesList of the top Palo Alto Networks outcomes expressed in total numbers.
Top SignaturesList of the top Palo Alto Networks signatures.
Top MalwareList of the top malware in your environment.